Data and statistics
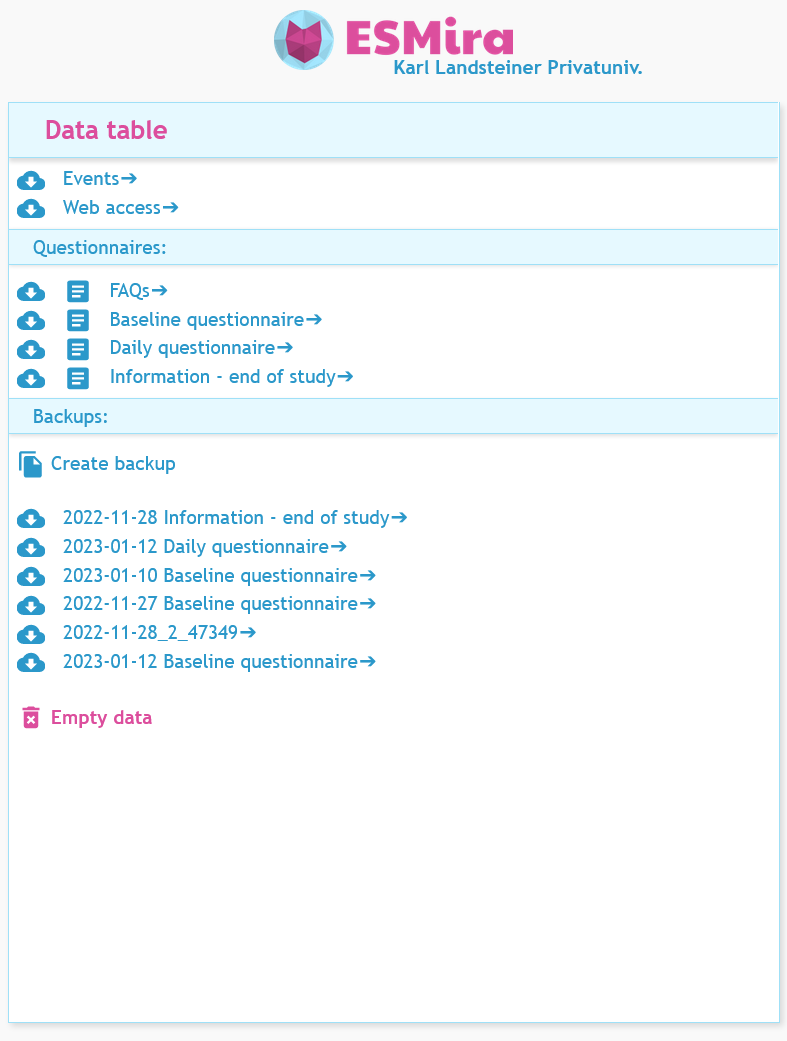
In the data table, you can view and download your study data. All data is saved in CSV format (separated by a semicolon). One for each questionnaire and additionally, there is a events.csv, and a web_access.csv. .
Note 1: When an item name in a questionnaire is changed after data was already saved for that questionnaire, a new column will be added in the according csv file (if it is not too big, see the note above). The old column with the former item name will stay but no more information will be saved for that variable.
Note 2: When a csv file is very big (greater than 1 gb) and items for that questionnaire are changed, a new csv will be created and the existing one will be treated as a backup.
Note 3: When an item in a questionnaire was removed after data was already saved for that questionnaire, the according csv file will stay the same but no new data will be saved for that column.
Apart from the columns which will depend on the created variables in a questionnaire, the following columns can be found in data files:
Note: Each "questionnaire" event has one entry in the csv file of the according questionnaire (where all response data is saved) and one entry in the event.csv, where you can find additional information like for example the app version, device mode or the os version.
All csv files (except the web_access.csv) have the following columns:
group: This column only exists if a study has multiple random groups
entryId: This id is unique for each entry and can be used to connect entries from the events.csv and its respective entry in a questionnaire file
userId: The user id of the participant. When using the app, the user id is randomly generated (in the Format ####-####-####). When using the web version of ESMira, the user id can be chosen by the participant.
uploaded: The unix timestamp (in milliseconds) for when the data was saved to the server. Be aware, that this value can significantly differ from "responseTime", when data was not immediately sent to the server (e.g. because there was no internet connection). When viewed in the web viewer, this value is displayed in a readable date-time format (you can view the timestamp by moving the mouse cursor over the value).
uploaded_formatted: The same value as "uploaded" but formatted in a readable date-time format. When viewed in the web viewer, this column is hidden.
appType: The type of app that was used for sending this event. Possible values are "Android", "Android_dev", "Android_wasDev", "iOS", "iOS_dev", "iOS_wasDev", "Web", "Web-NOJS". "Web-NOJS" is saved when the fallback web version that does not use JavaScript was used. "XXX_dev" is saved when the developer mode is enabled. "XXX_wasDev" is saved when developer mode was enabled in the past but is disabled now.
appVersion: The version of the app that was used for sending this event.
studyId: The internal id of the study.
accessKey: The access key that was used when joining the study.
studyVersion: The version of the study the participant was using when this event was sent.
studyLang: The language that was set for a participant when this entry was created.
questionnaireName: The group name this event is associated with. If no group was associated with this event, this is left empty.
eventType: The name of the according event (See Events for more information on events).
timezone: The timezone of the device, that was used by the participant.
responseTime: The unix timestamp (in milliseconds) for when the event itself was recorded. Be aware, that this value can significantly differ from "uploaded", when data was not immediately sent to the server (e.g. because there was no internet connection). When viewed in the web viewer, this value is displayed in a readable date-time format (you can view the timestamp by moving the mouse cursor over the value).
responseTime_formatted: The same value as "responseTime" but formatted in a readable date-time format. When viewed in the web viewer, this column is hidden.
Each variable in a questionnaire, represents a column in the csv file. For each time a participant fills out a questionnaire, a line in the according questionnaire csv file is created, and the participants' responses are saved in the according columns.
On top of the variable columns and Base Columns a questionnaire csv also has the following columns:
formDuration: Represents the number of milliseconds the participant needed to complete the questionnaire.
lastInvitation: The unix timestamp (in milliseconds) for the time of the last issued invitation to the questionnaire. When viewed in the web viewer, this value is displayed in a readable date-time format (you can view the timestamp by moving the mouse cursor over the value).
lastInvitation_formatted: The same value as "lastInvitation" but formatted in a readable date-time format. When viewed in the web viewer, this column is hidden.
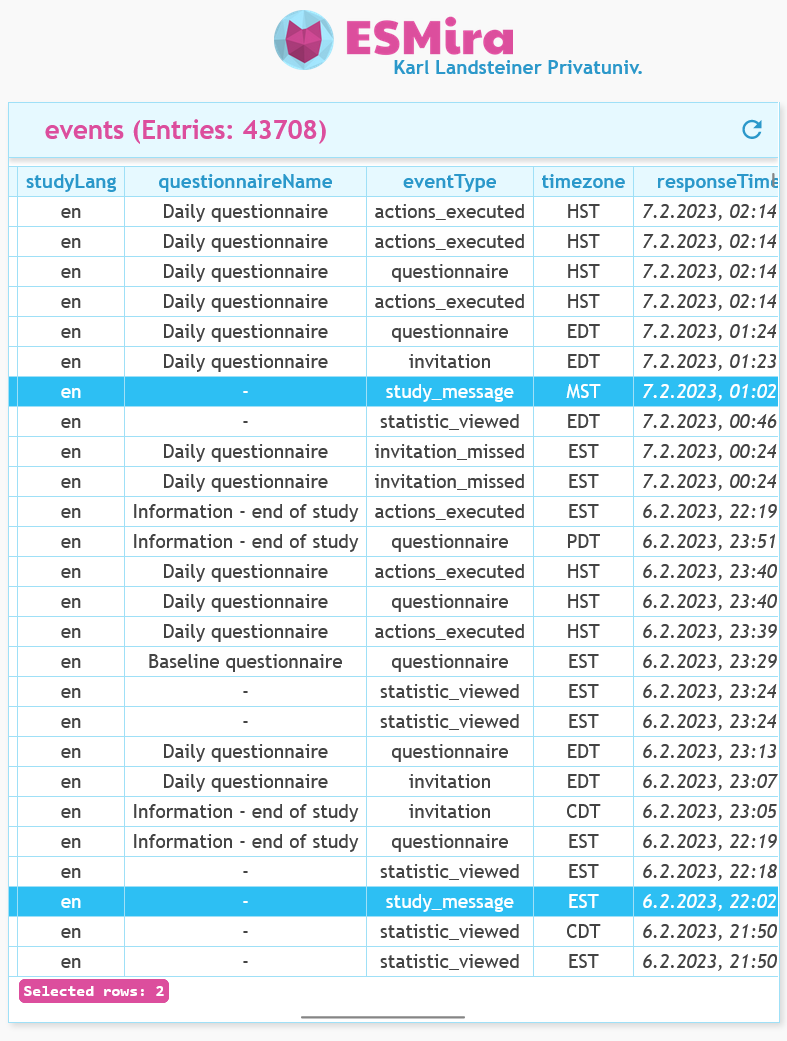
For each event (e.g. "joined", "questionnaire" or "quit") that is sent to the server, one entry will be created in this file. This file is meant to give a quick overview over (recent) activities in your study.
On top of the Base Columns, the events.csv also has the following columns:
newSchedule: Only set when the event type is "schedule_changed". The new schedule that was set by the participant.
actionScheduledTo: A unix timestamp (in milliseconds) representing the time when a scheduled action was supposed to be triggered. Is only set when the event type is "invitation", "notification", "reminder", "invitation_missed", "message" or "actions_executed". When viewed in the web viewer, this value is displayed in a readable date-time format (you can view the timestamp by moving the mouse cursor over the value).
actionScheduledTo_formatted: The same value as "actionScheduledTo" but formatted in a readable date-time format. When viewed in the web viewer, this column is hidden.
model: The name of the device that was used by the participant. When using the web version, the User Agent String is saved.
osVersion: The version of the Operating System of the device that was used by the participant (is left empty when using the web version since this information is already included in the User Agent String).
manufacturer: The manufacturer of the device that was used by the participant (is left empty when using the web version since this information is already included in the User Agent String).
The web page keeps track when people access your study through the browser. One line in the csv represents a single page access.
responseTime: The unix timestamp (in milliseconds) for when a web access itself was recorded. When viewed in the web viewer, this value is displayed in a readable date-time format (you can view the timestamp by moving the mouse cursor over the value).
responseTime_formatted: The same value as "responseTime" but formatted in a readable date-time format. When viewed in the web viewer, this column is hidden.
page: The page that was accessed (See Urls to web version for more information). Possible values are:
app_install (the direct link to the app install instructions), study (the direct link to the study information), questionnaire [Questionnaire Index] (the direct link to a specific questionnaire), navigatedFromHome (when the participant has navigated to the study from the starting page), navigatedFromHome_noJs (the same as "navigatedFromHome" but when the user has JavaScript disabled).
referer: The HTTP Referrer String that is sent by the browser when accessing the web page.
Note: To provide anonymity, not the complete referrer is saved. Instead, the complete url is stripped and only the domain name is saved.
userAgent: The User Agent String that is sent by the browser.
To get an in depth overview over your data, you can have charts be calculated out of the study data.
In the summary you will find a collection of charts to give you a quick overview over the current state of your study. Depending on the size of your event.csv, the site may need a view seconds to finish loading.
This gives you detailed information about specific participants. If you have created individual charts for the study, they are calculated as well.
Here, you will find a collection of charts detailing monthly and daily page views.
These are the public statistics that can be viewed by everyone who has access to the study.
The script logs panel collects both error logs by custom Merlin scripts, as well as user logs triggered in those scripts. It will be highlighted if unread logs are present.

When using the Reward-system, this is for validating reward codes that were sent to you by participants.