v.01
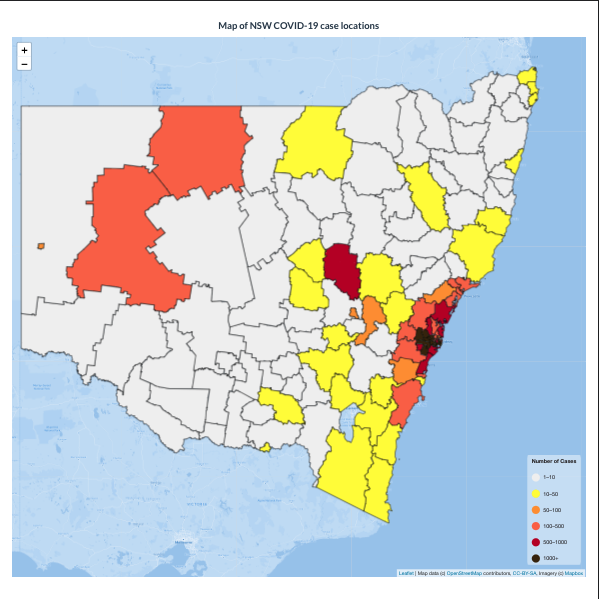
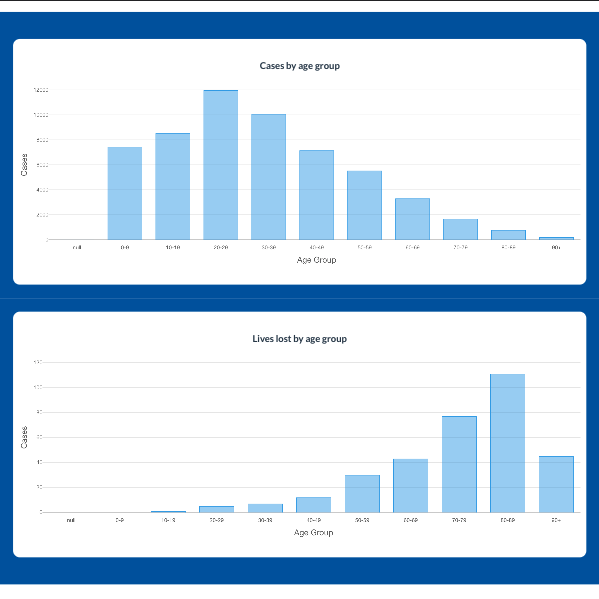
CovInfo is a single-page app to track the NSW COVID-19 situation. NSW government APIs are used to fetch the latest COVID-19 info, then all data is visualised using chart.js and Mapbox.
This web app is built using Node.js for the back-end and Vue.js as a front-end framework. GeoJson of NSW states and suburbs were used to tile and colour code the map based on the current COVID cases.
Live demo: https://cov-info-app.herokuapp.com
- To Represente updated info of NSW COVID-19 stats
- To become more familiar with the challenges of a team environment throughout the development lifecycle.
- To predefine the design and wireframe using Pigma.
- To get more practice with Node.js and Vue.js as well as the challenges of utilising a live map, using GeoJson, tiling and colour-coding the map.
- Clone both Client and Server Repos
- Install all dependencies by
npm install - Run the server for Server Version of the app by
npm start - Run the server for Client Version of the app by
npm run serve
- Back-end
- express
- axios
- cors
- front-end
- axios
- chart.js
- leaflet
- lodash
- Node JS
- Vue JS
- Express JS
- Mapbox
- Chart JS
- Hess Taba https://github.com/hesstab
- Mo Abyari https://github.com/MoAbyari