-
Notifications
You must be signed in to change notification settings - Fork 0
MATLAB
Reproduced from http://web.khu.ac.kr/~tskim/PM_2_3_Introduction%20to%20Matlab%202.pdf
MATLAB is a high-performance programming environment for numerical and technical applications. The first version was written at the University of New Mexico in the 1970s. The “MATrix LABoratory” program was invented by Cleve Moler to provide a simple and interactive way to write programs using the Linpack and Eispack libraries of FORTRAN subroutines for matrix manipulation. MATLAB has since evolved to become an effective and powerful tool for programming, data visualisation and analysis, education, engineering and research.
The strengths of MATLAB include extensive data handling and graphics capabilities, powerful programming tools and highly advanced algorithms. Although it specialises in numerical computation, MATLAB is also capable of performing symbolic computation by having an interface with Maple (a leading symbolic mathematics computing environment). Besides fast numerics for linear algebra and the availability of a large number of domainspecific built-in functions and libraries (e.g., for statistics, optimization, image processing, neural networks), another useful feature of MATLAB is its capability to easily generate various kinds of visualisations of your data and/or simulation results.
For every MATLAB feature in general, and for graphics in particular, the usefulness of MATLAB is mainly based on the large number of built-in functions and libraries. The intention of this tutorial is not to provide a comprehensive coverage of all MATLAB features but rather to prepare you for your own exploration of its functionality.
Option 1: via GUI
- Login to MASSIVE desktop
- Go To Applications > General Scientific > MATLAB

Option 2: via command line
- Login to MASSIVE desktop
- Right click > Open in terminal
- Type
module load matlab/r2022b - Type
matlab &

Follow the Monash Uni instructions here: https://www.monash.edu/esolutions/software/mathworks-register
Get Started with MATLAB (~30-60mins)
This tutorial from MathWorks provides an introduction to the graphical user interface (GUI), matrices and arrays, text and characters, generating plots, and making functions and scripts - all the basics you need to get started reading and writing code. You should be very familiar with all the content covered in this short course.
Alternatively, Mathworks has the same content presented with videos ~1-2 hours
You should be very familiar with all the content covered in this tutorial. You should be able to generate and manipulate matrices, and make simple plots like these:
The Basics of Plotting in MATLAB (~10-20 mins)
A super short and concise tutorial to provide some introductions to plotting in 2-D and 3-D. Highly recommend!
You can have a look at the MathWorks Graphics Intro page for some further details if you want.
You should be very familiar with all the content covered in this tutorial. You should be able to generate multiple plots, and make more complex 3-D plots like these:
This tutorial from our labs provides an introduction to visualisaing data in MATLAB, including graphs, heatmaps, and 3-D interactive brain visualisations. It also shows how to install libraries from GitHub and NITRC and use of the MATLAB path. You can follow the course through the instructions in the README and the comments in MATLAB_connectome_intro.m. You should be very familiar with all the content covered in this short course.
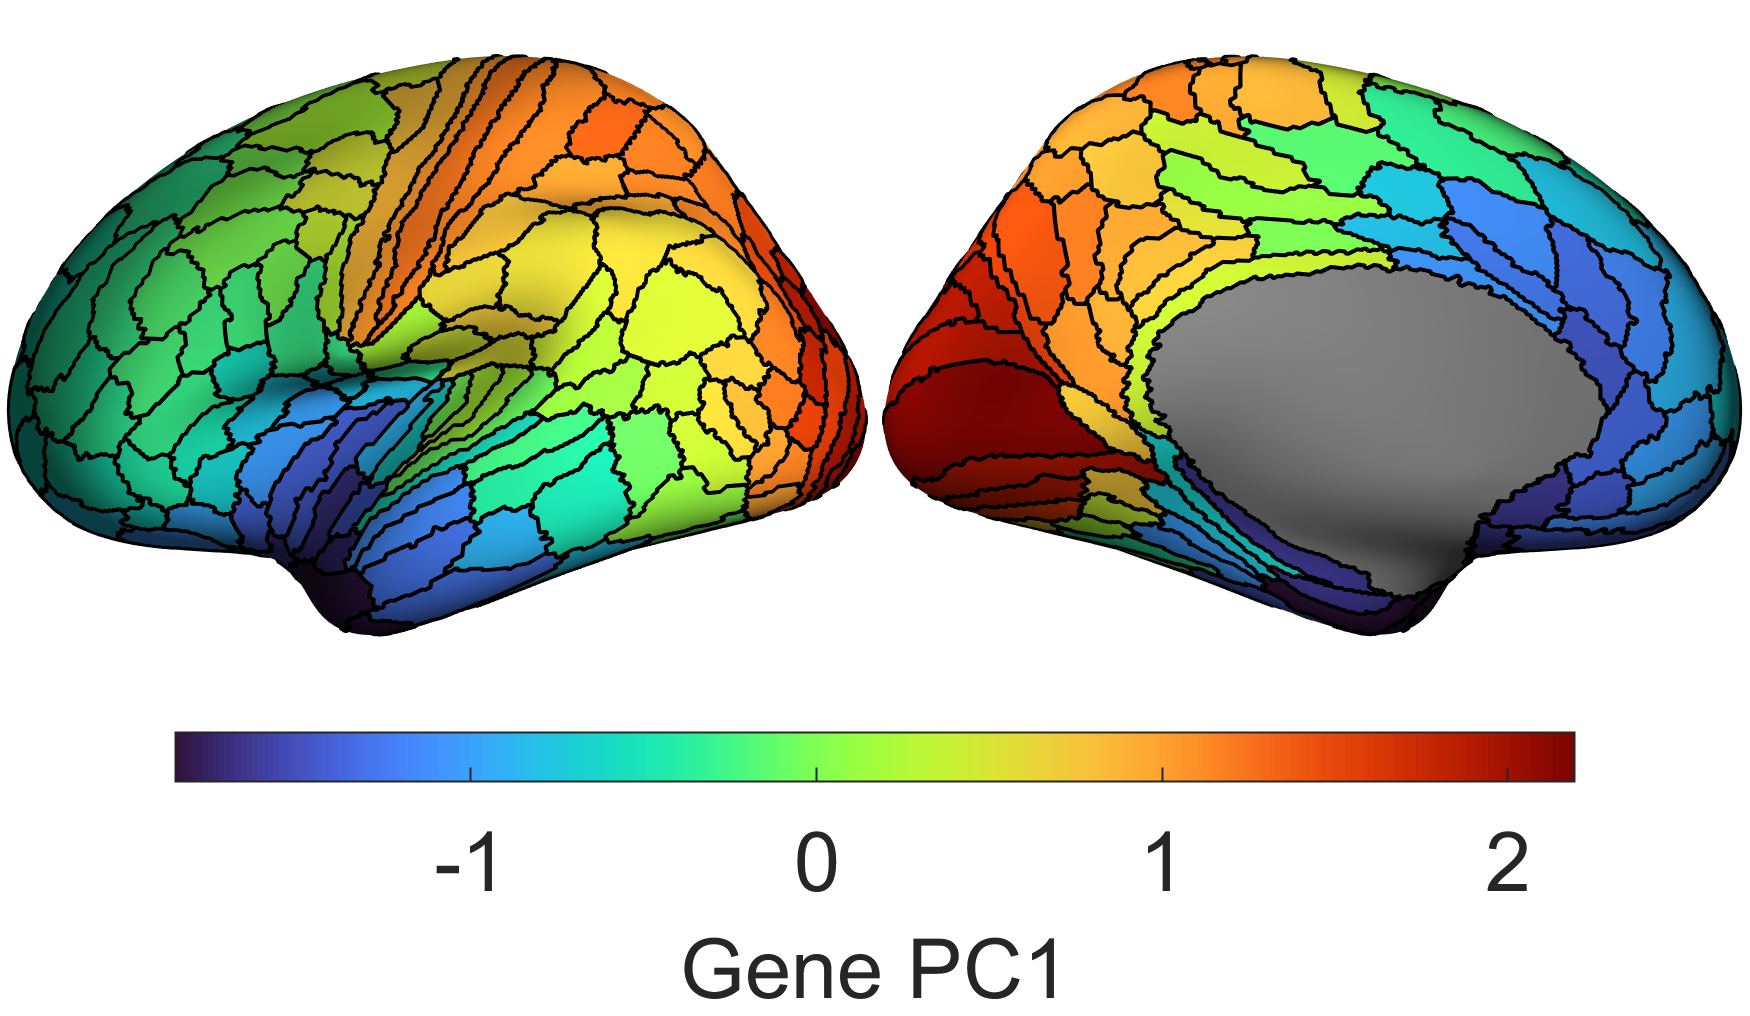
You should be used to working with matrices, importing and exporting data, and visualising data on brain surfaces like these:

-
FreeSurfer runtime in MATLAB: for reading many FreeSurfer file formats like
.annotfiles (read_annotation.m),.curv(read_curv.m), etc.
- plotSurfaceRoiBoundary: For visualisation of data on the brain surface
- BMH_utils_matlab : Useful functions from the lab, including for brain data visualisation
-
cifti-matlab: For reading CIFTI data like
XXX.dscalar.niifiles.
-
gifti: For reading GIFTI data like
XXX.giifiles.
- BMH_utils_matlab : Useful functions from the lab, including for brain data visualisation
-
toolbox-graph: which contains the hekpful files
compute_mesh_laplacian.m(related to eigenmodes) andread_vtk.m(for reading in surface files). - NBS (Brain Connectivity Toolbox) for analysing all subnetworks of edges
- SPM for fMRI analysis
- Gradient based analyses, which also includes examples for loading and plotting fMRI data and FC
- You'll find some more advanced techniques on the MathWorks help pages, e.g. data importing and analysis, debugging and testing.
- 0.0 NSB Programming Courses (in ALPHA)
- 1.0 Working on the Cluster
- 2.0 Programming Languages
- 2.1 Python
- 2.1.1 Getting Set Up
- 2.1.2 Coding in Python
- 2.1.3 Applications of Python in Neuroimaging
- 2.2 MATLAB
- 2.3 R and RStudio
- 2.4 Programming Intro Exercises
- 2.5 git and GitHub
- 2.6 SLURM and Job Submission
- 2.1 Python
- 3.0 Neuroimaging Tools and Packages
- 3.1 BIDS
- 3.2 FreeSurfer
- 3.3 FSL
- 3.4 Connectome Workbench/wb_command
- 3.5 fMRIPrep
- 3.6 QSIPrep
- 3.7 MICApipe
- 3.8 MRIQC
- 4.0 Specialist Tools

