Update filters in AEP class #173
Conversation
Codecov Report
@@             Coverage Diff             @@
##           develop     #173      +/-   ##
===========================================
- Coverage    66.66%   66.50%   -0.17%
===========================================
  Files           23       24       +1
  Lines         1758     1803      +45
===========================================
+ Hits          1172     1199      +27
- Misses         586      604      +18
Continue to review full report at Codecov.
|

|
After way too many commits today, I have a question for the rest of the team (@jordanperr, @RHammond2, @ejsimley). I have setup the code so that the outlier detection algorithm is NOT the default (outlier_detection=False, line 84 in the plant_analysis class). The MANY commits from today were me trying to understand which new part of the plant_analysis class is causing this issue. And it looks like this is coming from lines 792-3 ("outlier_threshold": np.random.randint(self.uncertainty_outlier[0] * 10,(self.uncertainty_outlier[1]) * 10, self.num_sim) / 10.). Right now, I have commented out those two lines, and the test are basically all passing (except for a VERY small discrepancy in the results of the check_simulation_results_gbm_daily test with 12.794527 vs 12.794528 for the mean AEP and 10.609839 vs 10.609942 for the AEP stdev). If I put back those two lines, the test results (with just 10 iterations) will be way off for ALL the regression setups (as an example, something like 12.09 vs 11.40 for the mean AEP in the monthly linear regression case). But again, those differences are not there if the Monte Carlo simulation is run with many more iterations. Do you have an idea on why this is happening? Is there something that can impact the order of the random iterations even with a set random.seed? |
 ejsimley
left a comment
ejsimley
left a comment
There was a problem hiding this comment.
Overall I think this looks good. Please see my comments in the code where I suggest making some minor changes and adding a bit to the documentation.
I also have a minor comment on the example 02_plant_aep_analysis notebook. In the description for "Step 8: Set up Monte Carlo inputs" I'd suggest specifying that outlier_detection is False by default, so outlier detection is not included in this example. Also, thanks for updating this list!
|
I have addressed @ejsimley's comments, and tested the bin filter on the 6 PRUF projects which have data at daily/hourly resolution. Results are stored here. For each wind plant, I have plotted the wind plant power curve (at daily and, where possible, hourly resolution) calculated using the bin filter, using the standard deviation setup. For each case, I have included a plot for each of the following thresholds: 1, 2 and 3 standard deviations. I have also fixed the bin filter in the TIE class (and relative example) to use the standard deviation option, too. This will slightly change the results in the TIE test, which I haven't updated yet. |
Update expected values for check_simulation_results_gam_daily_outliers (this test is being introduced in this PR. The old numbers were obtained with the 'scalar' version of the bin filter and therefore need to be updated).
Fixing one typo
|
I was able to fix the last issues. The only one that remains now is for the TIE test. The expected values for that test have changes after I modified how the bin filter is applied in the TIE class. Are we OK updating these values in the test? I know we had some discussion about this in the past (@jordanperr), so happy to get other ideas. |
ejsimley
left a comment
There was a problem hiding this comment.
Hi Nicola, this looks good to me overall! I just had a few small comments in the code. Also, here are some comments on the notebook examples:
- Notebook 02: Step 8: Again, thanks for updating the Monte Carlo parameters and their descriptions! Although it is not an argument, I think it would be worth mentioning that the operational data are randomly resampled each iteration using bootstrapping to help quantify uncertainty in the results as well.
- Notebook 02: Step 8: For the "uncertainty_nan_energy" parameter, I might suggest being a little more specific and saying that this is the threshold for removing days/months based on the fraction of NaNs in the data.
- Notebook 02b: Thanks for adding some additional discussion at the end of the "Comparison 1" section. The only thing I can think of adding would be if there is anything about the results for the different ML methods that you think is worth commenting on. For example, are there any reasons why someone would choose certain methods over others?
- Notebook 03: In the "TIE calculation without uncertainty quantification" section, I think the text "The long-term TIE value of 13.7..." should be changed to "13.6" to match what gets printed.
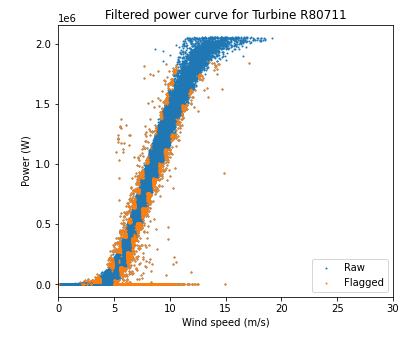
- The filtered power curve plots look like they are removing way too many points, especially at low wind speeds. Any idea what is going on here?
- In the "TIE calculation including uncertainty quantification" section, can you clear the output of the
ta.runcell, so all the outputs don't show up on GitHub and the documentation? For example, see how it is currently saved in the main or develop branch.
One more general comment (no action needed now) is that after the reanalysis start/end date PR is merged, the results in the notebooks will change slightly and the test results will change, so we'll need to update the tests and probably the notebook descriptions slightly once that happens. I'm fine with merging this PR in first though.
|
@nbodini, also, I think it's fine to update the test results as long as they look reasonable to you. |
|
Thanks for your comments, @ejsimley. Re: choice between different ML algorithms in notebook 2b, we haven't really investigate that in much detail (yet). The only consideration I could think of is the following: "Finally, we note how the GBM and ETR regression models are more computationally expensive than the GAM regression model. However, as ensemble-based models, they are expected to be capable of better modeling complex relationships." For the power curves in the Drive folder, not 100% sure I get what you mean. Especially at hourly resolution, a lot of points are discarded when the bin filter threshold is 1, but on the other hand when the threshold is 3, way fewer points are discarded.. but I am probably missing something, so let me know! |
|
@nbodini Regarding the comment "The filtered power curve plots look like they are removing way too many points, especially at low wind speeds", I totally agree that the plots in the Drive folder you shared look good. I should have clarified that I was referring to the plots generated in the example 03 notebook. There it looks to me like too many points are being filtered out at low wind speed/power. Do you know why this might be the case? |
I thought 6 decimals were required to be equal as default, but it seems like it's 7...
|
@ejsimley I have now fixed everything, but... I thought about this issue with the power curve, and I think the issue is not specific to this example, but actually applies to all power curves. And it's probably something we didn't think about before (at least, I haven't). This is not a trivial aspect, and probably one of the reasons why Mike had used the stdev setting of the bin filter instead.. what do you think? |
ejsimley
left a comment
There was a problem hiding this comment.
Your latest changes all look good to me @nbodini. I only noticed one thing. Since we decided to change the default "UQ" argument to True in the TIE class, some of the notebooks need to be updated to reflect that. In example 03 in section 1.1, when the TurbineLongTermGrossEnergy object is created, now we need to explicitly say UQ=False. Same comment applies when TIE is computed in the example 05 notebook.
Also, I thought about the bin filter issue for example 03 a little more and looked into the results. First of all, I think the reason the filter seems to be so much stricter than the plots you shared in Drive is that those plots were for the wind plant power curves vs. reanalysis wind speeds instead of turbine power curves vs. SCADA wind speeds. Since there is more scatter in the reanalysis data plots, the std. dev. values are higher, and a wider range of wind speeds are kept after filtering. I guess that's obvious, but I just forgot about that when I was comparing the two cases.
Then I think what's happening for the TIE power curves in example 03 compared to the TIE power curves from the gap analysis paper is that the La Haute Borne data are much cleaner (there are fewer outlier points due to underperformance or turbine shutdowns, etc.). So naturally the std. dev. will be much lower for the LHB data and a narrower range of wind speeds is kept after filtering. That being said, I verified that only ~2-3% of data points get removed by the bin filter in example 03, which seems reasonable to me. So I'm thinking that the default parameters are still ok, but it would still be a good idea to adjust them depending on the project (for example, if we included the LHB data in a paper, we might consider increasing the thresholds)
ejsimley
left a comment
There was a problem hiding this comment.
This looks good to me now. @RHammond2 were you planning to take a look as well, or should we just merge it when we're ready?
 RHammond2
left a comment
RHammond2
left a comment
There was a problem hiding this comment.
Overall, this looks good from my perspective with only three minor things (2 with comments and one general) that I'll put here for convenience.
- There was a 30 day assumption for month length, is this always going to be correct for reanalysis data, or should it be dynamic for the month? I might be missing some background on that decision, so apologies if this has already been addressed.
- Docstring parameter descriptions don't need to be indented all the way to the colon, just two spaces in from the start of the parameter name for continuation lines.
- Would you be able to run pre-commit on this, there were a couple of formatting changes that seemed slightly odd, so I just want to double check on that. You will also need to change the following in
.pre-comit-config.yamldue to flake8 changing repositories.
Remove lines 39-41 (looks like below):
    -   id: flake8
        additional_dependencies: [flake8-docstrings]
        exclude: ^tests/
And add the following:
-   repo: https://github.com/pycqa/flake8
    rev: '4.0.1'
    hooks:
    -   id: flake8
Then run the following in your terminal:
pre-commit autoupdate
git add .pre-commit-config.yaml
pre-commit run --files operational_analysis/methods/plant_analysis.py operational_analysis/methods/turbine_long_term_gross_energy.py
I can also make the change for the last item if you'd prefer, or if it's easier @ejsimley prior to the v2.3 release, we can have a small PR making these edits, but I might be in favor of having it done in the proper PR so the changes can be attributed more accurately.
|
Thanks for your comments, @RHammond2. I have incorporated the first two comments, and I would leave the third one to you if you don't mind (I am afraid I would mess up something I am not familiar with..). Thanks! |
|
@nbodini that works for me, and so I've just updated the pre-commit file and the two python methods files this PR modifies, which puts everything where it should be from my perspective. |
|
Thanks Rob and Nicola for the quick review and edits! @nbodini, would you like to merge this? Or let me know if you'd like me to do that. @RHammond2, good catch with the flake8 changes. For those who have been using the pre-commit hooks already, is there anything we need to do to update pre-commit, or did your latest commit take care of everything for now? For example, I wasn't sure if everyone needed to run the commands: |
This PR updates the filters applied in the plant_analysis class.
Specifically, the proposed changes will:
a) at monthly resolution, a robust linear regression approach is implemented to detect outliers. This is the same approach that was originally used in the class.
b) at daily/hourly resolution, a bin filter approach is used. This is consistent with what is used, at a turbine level, in the TIE calculation. A robust linear regression approach is not appropriate at these time resolutions as the relationship between wind speed and power is not linear at such fine scales.