-
Notifications
You must be signed in to change notification settings - Fork 331
A. 空气质量数据
PKUJohnson edited this page Jul 22, 2019
·
4 revisions
OpenDataTools通过aqi接口,支持对城市空气质量数据的获取,要求版本0.9.3以上。
数据来源:aqistudy.cn,环保部网站(已限流,无法正常使用)
from opendatatools import aqi2- 获取某个时点,所有城市的aqi数据
df, msg = aqi2.get_aqi_map("HOUR", "2019-07-22 08:00:00")
df.head(20)- 获取某日的aqi(所有城市)
df, msg = aqi2.get_aqi_map("DAY", "2019-07-21")
df.head(20)- 获取城市列表
citylist = aqi2.get_city_list()
print(citylist)- 获取单个城市某日的AQI数据(小时级别)
df, msg = aqi2.get_daily_hour_aqi(city, "2019-07-22")
df.head(20)- 获取单个城市某段时间的AQI数据(日级别)
df, msg = aqi2.get_hist_daily_aqi(city, "2019-07-01", "2019-07-22")
df.head(20)- 一个小小的例子
# 几个重点城市的数据
for city in ["北京", "上海", "三亚", "深圳"]:
    print(city)
    df, msg = aqi2.get_hist_daily_aqi(city, "2019-07-01", "2019-07-22")
    print(df)

    df, msg = aqi2.get_daily_hour_aqi(city, "2019-07-22")
print(df)from opendatatools import aqi- 获取某日全国各大城市的AQI数据
df = aqi.get_daily_aqi('2018-01-01')
df.head(20)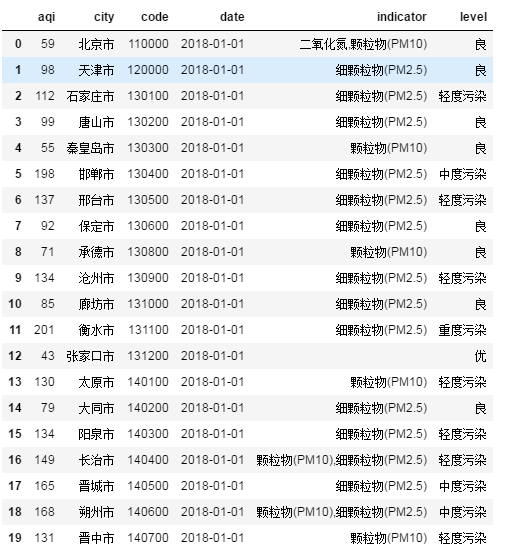
- 获取单个城市的AQI历史数据
df = aqi.get_daily_aqi_onecity('上海市')
df.head(20)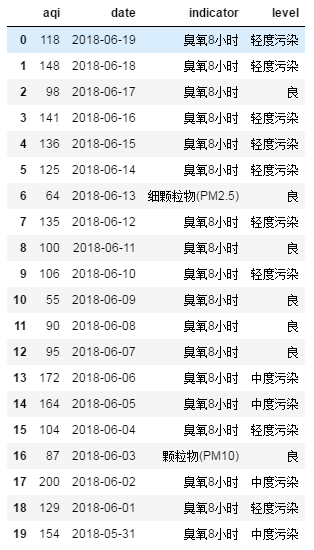
- 获取单个城市某日的AQI小时数据
aqi_hour = aqi.get_hour_aqi_onecity('北京市', '2018-06-19')
aqi_hour.set_index('time', inplace=True)
aqi_hour.head(20)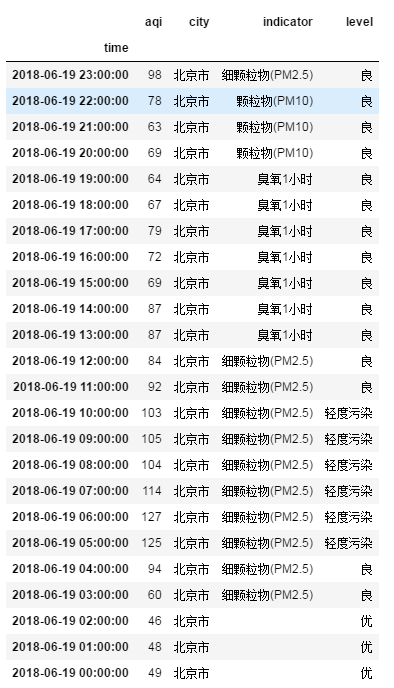
- 获取实时AQI小时数据
aqi_hour = aqi.get_hour_aqi()
aqi_hour.head(20)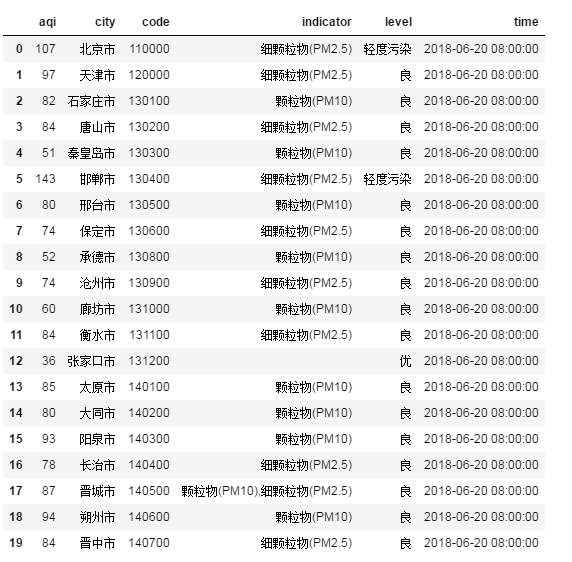
- Example1: 北京市AQI趋势图
from pyecharts import Line

df_aqi = aqi.get_daily_aqi_onecity('北京市')
df_aqi.set_index('date', inplace=True)
df_aqi.sort_index(ascending=True, inplace=True)

df_aqi = df_aqi[df_aqi.index >= "2018-01-01"]

axis_x = df_aqi.index
axis_y = df_aqi['aqi']

line = Line("北京AQI趋势图")
line.add("aqi curve for beijing", axis_x, axis_y, mark_point=["average"])
line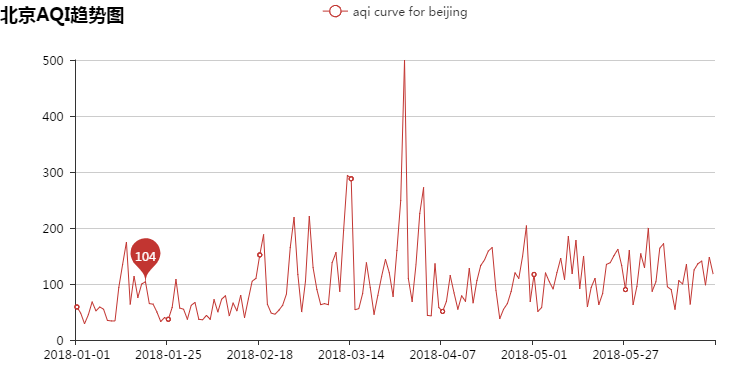
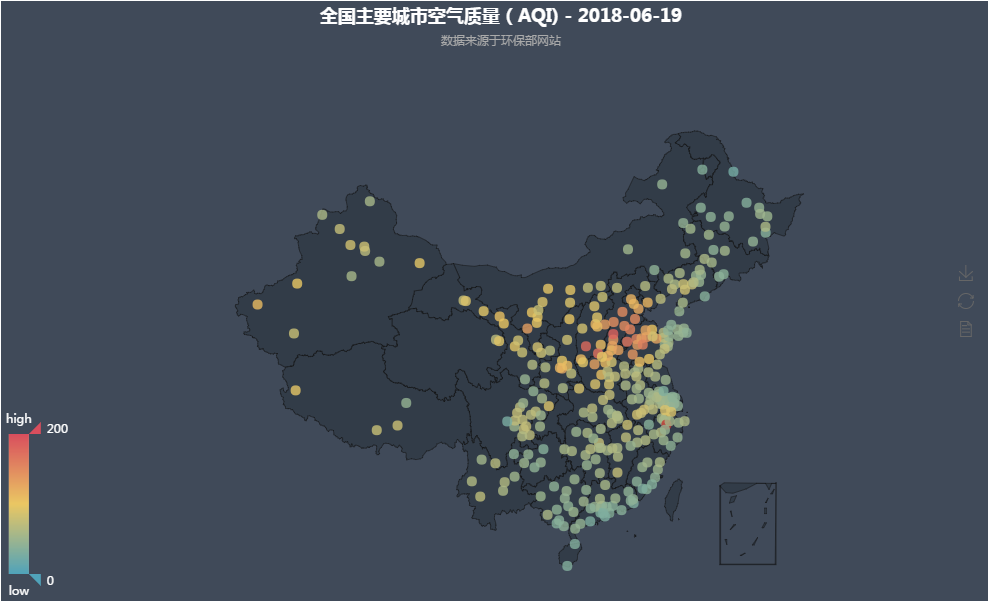
- Example1: 全国AQI实时地图
from pyecharts import Geo

df_aqi = aqi.get_daily_aqi('2018-06-19')

# some city cannot by process by echart
echart_unsupported_city = ["菏泽市", "襄阳市", "恩施州", "湘西州","阿坝州", "延边州",
                           "甘孜州", "凉山州", "黔西南州", "黔东南州", "黔南州", "普洱市", "楚雄州", "红河州",
                           "文山州", "西双版纳州", "大理州", "德宏州", "怒江州", "迪庆州", "昌都市", "山南市",
                           "林芝市", "临夏州", "甘南州", "海北州", "黄南州", "海南州", "果洛州", "玉树州", "海西州",
                           "昌吉州", "博州", "克州", "伊犁哈萨克州"]

data = []
for index, row in df_aqi.iterrows():
    city = row['city']
    aqi  = row['aqi']

    if city in echart_unsupported_city:
        continue

    data.append( (city, aqi) )

geo = Geo("全国主要城市空气质量(AQI) - 2018-06-19", "数据来源于环保部网站",
          title_color="#fff",
          title_pos="center", width=1000,
          height=600, background_color='#404a59')
attr, value = geo.cast(data)
geo.add("", attr, value,
        visual_range=[0, 200], maptype='china',visual_text_color="#fff",
        symbol_size=10, is_visualmap=True,
        label_formatter='{b}',  # 指定 label 只显示城市名
        tooltip_formatter='{c}',  # 格式:经度、纬度、值
        label_emphasis_textsize=15,  # 指定标签选中高亮时字体大小
        label_emphasis_pos='right'  # 指定标签选中高亮时字体位置
    )

geo