Debug visualization of Rust data structures #160
Labels
Comments
|
I think GDBEng is at https://github.com/Microsoft/MIEngine so maybe 1 is posibal. |
|
See also https://internals.rust-lang.org/t/debugging-rust-programs-on-windows-with-visual-studio-windbg/3848 about better support for the native MSVC debugger. |
|
rust-lang/rust#36503 is related |
bors
added a commit
to rust-lang/rust
that referenced
this issue
Jul 28, 2017
…erister
Embed MSVC .natvis files into .pdbs and mangle debuginfo for &str, *T, and [T].
No idea if these changes are reasonable - please feel free to suggest changes/rewrites. And these are some of my first real commits to any rust codebase - *don't* be gentle, and nitpick away, I need to learn! ;)
### Overview
Embedding `.natvis` files into `.pdb`s allows MSVC (and potentially other debuggers) to automatically pick up the visualizers without having to do any additional configuration (other than to perhaps add the relevant .pdb paths to symbol search paths.)
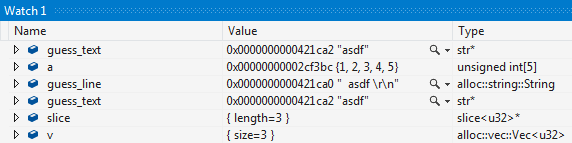
The native debug engine for MSVC parses the type names, making various C++ish assumptions about what they mean and adding various limitations to valid type names. `&str` cannot be matched against a visualizer, but if we emit `str&` instead, it'll be recognized as a reference to a `str`, solving the problem. `[T]` is similarly problematic, but emitting `slice<T>` instead works fine as it looks like a template. I've been unable to get e.g. `slice<u32>&` to match visualizers in VS2015u3, so I've gone with `str*` and `slice<u32>*` instead.
### Possible Issues
* I'm not sure if `slice<T>` is a great mangling for `[T]` or if I should worry about name collisions.
* I'm not sure if `linker.rs` is the right place to be enumerating natvis files.
* I'm not sure if these type name mangling changes should actually be MSVC specific. I recall seeing gdb visualizer tests that might be broken if made more general? I'm hesitant to mess with them without a gdb install. But perhaps I'm just wracking up technical debt.
Should I try `pacman -S mingw-w64-x86_64-gdb` and to make things consistent?
* I haven't touched `const` / `mut` yet, and I'm worried MSVC might trip up on `mut` or their placement.
* I may like terse oneliners too much.
* I don't know if there's broader implications for messing with debug type names here.
* I may have been mistaken about bellow test failures being ignorable / unrelated to this changelist.
### Test Failures on `x86_64-pc-windows-gnu`
```
---- [debuginfo-gdb] debuginfo-gdb\associated-types.rs stdout ----
thread '[debuginfo-gdb] debuginfo-gdb\associated-types.rs' panicked at 'gdb not available but debuginfo gdb debuginfo test requested', src\tools\compiletest\src\runtest.rs:48:16
note: Run with `RUST_BACKTRACE=1` for a backtrace.
[...identical panic causes omitted...]
---- [debuginfo-gdb] debuginfo-gdb\vec.rs stdout ----
thread '[debuginfo-gdb] debuginfo-gdb\vec.rs' panicked at 'gdb not available but debuginfo gdb debuginfo test requested', src\tools\compiletest\src\runtest.rs:48:16
```
### Relevant Issues
* #40460 Metaissue for Visual Studio debugging Rust
* #36503 Investigate natvis for improved msvc debugging
* PistonDevelopers/VisualRust#160 Debug visualization of Rust data structures
### Pretty Pictures

|
MSVC toolchain builds now embed .natvis files into built .pdbs if available. Probably still room for improvement in GNU toolchain builds. |
Sign up for free
to join this conversation on GitHub.
Already have an account?
Sign in to comment
Currently VS GDB engine (GDBEng) doesn't support GDB's "pretty printers", so
Strings,Vecsand otherHashMapslook pretty incomprehensible in the variable inspector. I've tried several approaches to address this, but so far without much success. Still, I thought I should document them here for posterity:-enable-pretty-printingcommand via init script. Unfortunately, GDB always interprets Python-based pretty-printers as "dynamic", i.e. with an unknown number of children (even if the pretty-printer'schildren()method returns a finite sequence). This results invarobj's like this:name="var1",numchild="0",dynamic="1",has_more="1" ..., which GDBEng doesn't know how to deal with.As far as I can see, the only way to make this approach work, is to fix the GDBEng, once Microsoft open-sources it.
Alas, this doesn't work either because of the confluence of two problems:
DW_AT_language=Rustattribute yet, it falls back to treating Rust modules as if they were C: all non-primitive type names are printed asstruct Foo, all namespaces are ignored, ditto for generic parameters.We could probably work around this by emitting
DW_AT_language=CPlusfor Rust modules, but that seems a bit too drastic for the sake of supporting one specific IDE. Although... C++ type system is probably closer to Rust than C is, so maybe it isn't such a bad idea? I wonder what @michaelwoerister thinks about this :)Although I've managed to build LLDB for Windows without much trouble, at the moment it looks pretty raw: Python does not initialize properly, single-line stepping is broken, etc, etc. Because of the problem with Python, I could not evaluate how well (or whether at all) LLDB's "data formatters" work over the MI interface.
The text was updated successfully, but these errors were encountered: