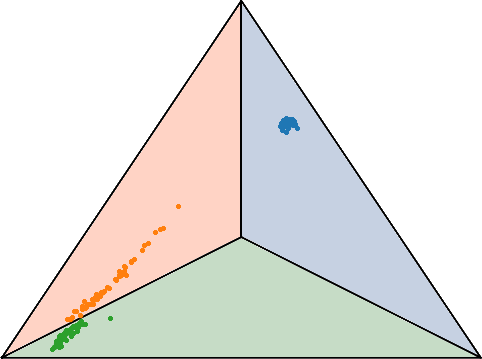

This Python project provides a supervised multi-class classification algorithm with a focus on calibration, which allows the prediction of class labels and their probabilities including gradients with respect to features. The classifier is designed along the principles of an scikit-learn estimator.
The details of the algorithm have been published in PLOS ONE (preprint: arXiv:2103.02926).
Complete documentation of the code is available via https://casimac.readthedocs.io/en/latest/. Example notebooks can be found in the examples directory.
Installation
Install the package via pip or clone this repository. In order to use pip, type:
$ pip install casimacGetting Started
Use the CASIMAClassifier class to create a classifier object. This object provides a fit method for training and a predict method for the estimation of class labels. Furthermore, the predict_proba method can be used to predict class label probabilities.
Below is a short example.
from casimac import CASIMAClassifier

import numpy as np
from sklearn.gaussian_process import GaussianProcessRegressor
import matplotlib.pyplot as plt

# Create toy data
N = 10
seed = 42
X = np.random.RandomState(seed).uniform(-10,10,N).reshape(-1,1)
y = np.zeros(X.size)
y[X[:,0]>0] = 1

# Classify
clf = CASIMAClassifier(GaussianProcessRegressor)
clf.fit(X, y)

# Predict
X_sample = np.linspace(-10,10,100).reshape(-1,1)
y_sample = clf.predict(X_sample)
p_sample = clf.predict_proba(X_sample)

# Plot result
plt.figure(figsize=(8,3))
plt.plot(X_sample,y_sample,label="class prediction")
plt.plot(X_sample,p_sample[:,1],label="class probability prediction")
plt.scatter(X,y,c='r',label="train data")
plt.xlabel("X")
plt.ylabel("label / probability")
plt.legend()
plt.show()
📖 Citation
If you find this code useful, please consider citing Calibrated simplex-mapping classification:
@article{10.1371/journal.pone.0279876,
      doi={10.1371/journal.pone.0279876},
      author={Heese, Raoul and Schmid, Jochen and Walczak, Micha{\l} and Bortz, Michael},
      journal={PLOS ONE},
      publisher={Public Library of Science},
      title={Calibrated simplex-mapping classification},
      year={2023},
      month={01},
      volume={18},
      url={https://doi.org/10.1371/journal.pone.0279876},
      pages={1-26},
      number={1}
      }
License
This project is licensed under the MIT License - see the LICENSE file for details.
This project is currently not under development and is not actively maintained.

