A lightweight, zero-dependency Python package for monitoring resource usage across processes and at the server level. Designed with batch jobs in mind (like Metaflow steps), it provides simple tools to track CPU, memory, GPU, network, and disk utilization with minimal setup -- e.g. using a simple step decorator in Metaflow to automatically track resource usage and generate a card with data visualizations on historical resource usage and cloud server recommendations for future runs.
You can install the stable version of the package from PyPI:
pip install resource-trackerDevelopment version can be installed directly from the repository:
pip install git+https://github.com/sparecores/resource-tracker.gitThe package comes with helper functions and classes for tracking resource usage,
such as PidTracker and SystemTracker:
from resource_tracker import SystemTracker
tracker = SystemTracker()
SystemTracker tracks system-wide resource usage, including CPU, memory, GPU, network
traffic, disk I/O and space usage every 1 second, and write CSV to the standard
output stream by default. Example output:
"timestamp","processes","utime","stime","cpu_usage","memory_free","memory_used","memory_buffers","memory_cached","memory_active_anon","memory_inactive_anon","disk_read_bytes","disk_write_bytes","disk_space_total_gb","disk_space_used_gb","disk_space_free_gb","net_recv_bytes","net_sent_bytes","gpu_usage","gpu_vram","gpu_utilized"
1741785685.6762981,1147955,40,31,0.7098,37828072,26322980,16,1400724,13080320,1009284,86016,401408,5635.25,3405.81,2229.44,10382,13140,0.24,1034.0,1
1741785686.676473,1147984,23,49,0.7199,37836696,26316404,16,1398676,13071060,1009284,86016,7000064,5635.25,3405.81,2229.44,1369,1824,0.15,1033.0,1
1741785687.6766264,1148012,38,34,0.7199,37850036,26301016,16,1400724,13043036,1009284,40960,49152,5635.25,3405.81,2229.44,10602,9682,0.26,1029.0,1
The default stream can be redirected to a file by passing a path to the csv_file_path
argument, and can use different intervals for sampling via the interval
argument.
The PidTracker class tracks resource usage of a running process and optionally
all its children (recursively), in a similar manner, although somewhat limited in
functionality, as e.g. nvidia-smi pmon can only track up-to 4 GPUs, and
network traffic monitoring is not available.
Helpers functions are also provided for tracking memory usage, e.g.
get_pid_stats and get_system_stats for current process and system-wide stats
-- which are used internally by the above classes after diffing values between
subsequent calls. See more details in the
API References.
The packages also comes with helpers for discovering the cloud environment and basic server hardware specs. Quick example on an AWS EC2 instance:
from resource_tracker import get_cloud_info, get_server_info
get_cloud_info()
# {'vendor': 'aws', 'instance_type': 'g4dn.xlarge', 'region': 'us-west-2', 'discovery_time': 0.1330404281616211}
get_server_info()
# {'vcpus': 4, 'memory_mb': 15788.21, 'gpu_count': 1, 'gpu_names': ['Tesla T4'], 'gpu_memory_mb': 15360.0}
Spare Cores integration can do further lookups for the current server type, e.g. to calculate the cost of running the current job and recommend cheaper cloud server types for future runs.
The package also comes with a Metaflow extension for tracking resource usage of
Metaflow steps, including the visualization of the collected data in a card with
recommended @resources and cheapest cloud server type for future runs, along
with basic cost estimates.
To get started, import the track_resources decorator from metaflow and use
it to decorate your Metaflow steps:
from metaflow import Flow, FlowSpec, step, track_resources
class ResourceTrackingFlow(FlowSpec):
@step
def start(self):
print("Starting step")
self.next(self.my_sleeping_data)
@track_resources
@step
def my_sleeping_data(self):
data = bytearray(500 * 1024 * 1024) # 500MB
sleep(3)
self.next(self.end)
@step
def end(self):
print("Step finished")
pass
if __name__ == "__main__":
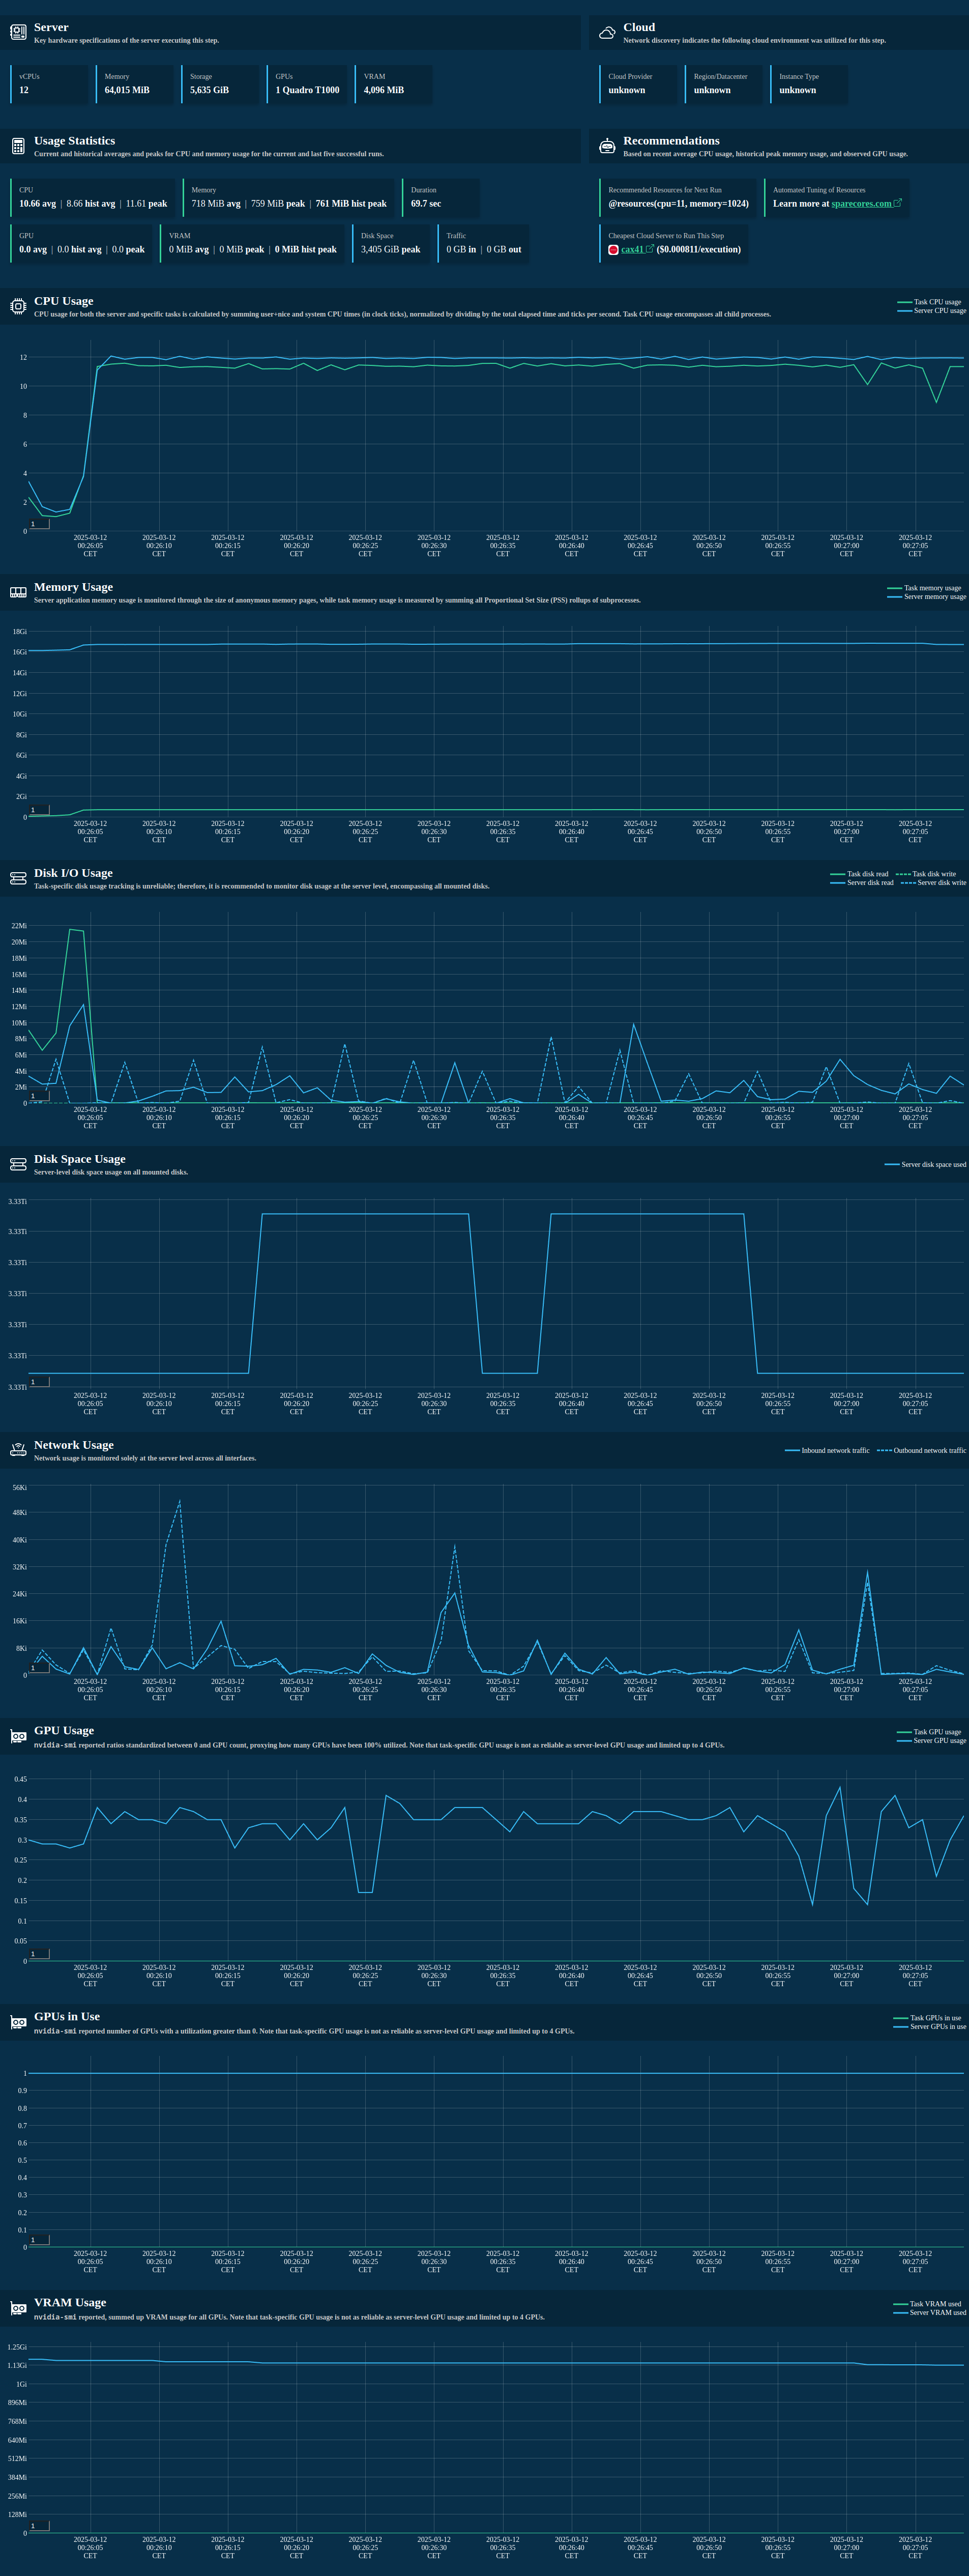
ResourceTrackingFlow()Example output of an auto-generated Metaflow card:
Example data collected and then stored as an artifact of the step:
from metaflow import Flow
from rich import print as pp

artifact = Flow("ResourceTrackingFlow").latest_run.data.resource_tracker_data
pp(artifact)
# {
#     'pid_tracker': TinyDataFrame with 9 rows and 12 columns. First row as a dict: {'timestamp': 1741732803.3076203, 'pid':
# 777691.0, 'children': 3.0, 'utime': 95.0, 'stime': 13.0, 'cpu_usage': 1.0796, 'pss': 563273.0, 'read_bytes': 52260.0,
# 'write_bytes': 0.0, 'gpu_usage': 0.0, 'gpu_vram': 0.0, 'gpu_utilized': 0.0},
#     'system_tracker': TinyDataFrame with 9 rows and 21 columns. First row as a dict: {'timestamp': 1741732803.2471318,
# 'processes': 777773.0, 'utime': 225.0, 'stime': 53.0, 'cpu_usage': 2.7797, 'memory_free': 38480700.0, 'memory_used':
# 24338580.0, 'memory_buffers': 4792.0, 'memory_cached': 2727720.0, 'memory_active_anon': 15931396.0, 'memory_inactive_anon':
# 0.0, 'disk_read_bytes': 380928.0, 'disk_write_bytes': 10088448.0, 'disk_space_total_gb': 5635.25, 'disk_space_used_gb':
# 3405.11, 'disk_space_free_gb': 2230.14, 'net_recv_bytes': 8066.0, 'net_sent_bytes': 8593.0, 'gpu_usage': 0.29, 'gpu_vram':
# 998.0, 'gpu_utilized': 1.0},
#     'cloud_info': {
#         'vendor': 'unknown',
#         'instance_type': 'unknown',
#         'region': 'unknown',
#         'discovery_time': 1.0617177486419678
#     },
#     'server_info': {
#         'vcpus': 12,
#         'memory_mb': 64015.42,
#         'gpu_count': 1,
#         'gpu_names': ['Quadro T1000'],
#         'gpu_memory_mb': 4096.0
#     },
#     'stats': {
#         'cpu_usage': {'mean': 1.42, 'max': 6.11},
#         'memory_usage': {'mean': 342509.0, 'max': 591621.0},
#         'gpu_usage': {'mean': 0.0, 'max': 0.0},
#         'gpu_vram': {'mean': 0.0, 'max': 0.0},
#         'gpu_utilized': {'mean': 0.0, 'max': 0.0},
#         'disk_usage': {'max': 3405.11},
#         'traffic': {'inbound': 77383.0, 'outbound': 58481.0},
#         'duration': 9.89
#     },
#     'historical_stats': {
#         'available': True,
#         'runs_analyzed': 5,
#         'avg_cpu_mean': 1.52,
#         'max_memory_max': 597372.0,
#         'avg_gpu_mean': 0.0,
#         'max_vram_max': 0.0,
#         'max_gpu_count': 0.0,
#         'avg_duration': 10.2
#     }
# }
Find more examples in the examples directory, including multiple Metaflow flows with different resource usage patterns, e.g. GPU jobs as well.
- PyPI: https://pypi.org/project/resource-tracker
- Documentation: https://sparecores.github.io/resource-tracker
- Source code: https://github.com/SpareCores/resource-tracker
- Project roadmap and feedback form: https://sparecores.com/feedback/metaflow-resource-tracker