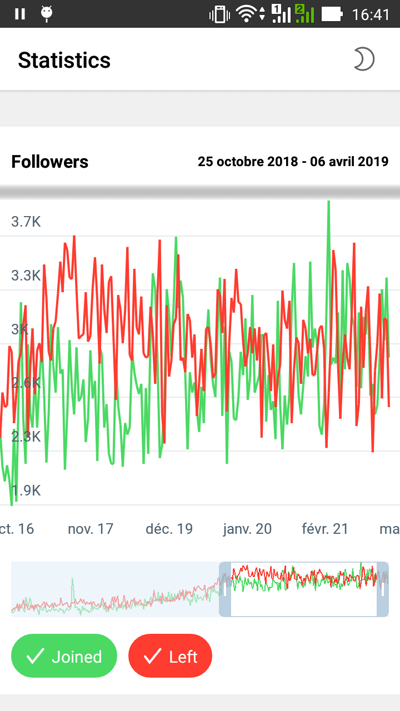
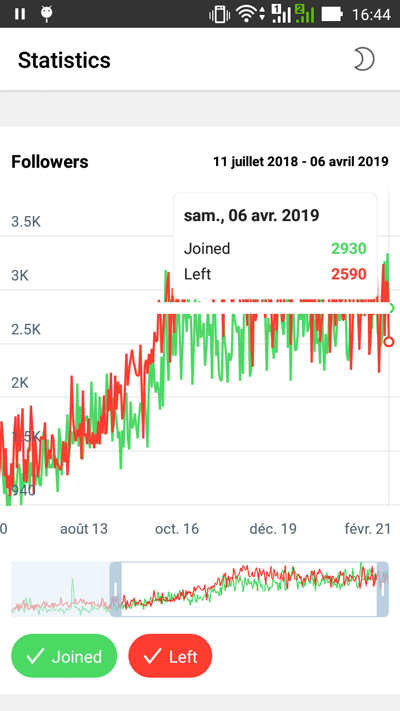
App for Telegram Chart Coding Competition for Android (stage 1 and stage 2).
Other screenshots are available here. There's also a video file with demonstration of the app (android studio captured the video at 24fps, so it might look not very smooth). Apk-files for both stages are available here.
Single-activity app. The JSON data is read from the assets directory.
Night and day themes are implemented with android-themes.
Charts are implemented as custom views with hardware accelerated Canvas drawing.
Animations are implemented using ValueAnimators.
The app supports configuration changes (for example, orientation change) - all states are saved and restored on Activity recreation.
Considering that the contest had narrow time frames (especially the second stage), some code might not look as good as it could.
The goal is to develop software for showing simple charts based on input data we provide. You can use either JavaScript, Android Java or iOS Swift.
Note: you may not use specialized charting libraries. All the code you submit must be written by you from scratch.
The criteria we’ll be using to define the winner are speed, efficiency and the size of the app.
The app should show 4 charts on one screen, based on the input data we will provide within the next 24 hours.
In the first stage my app got the 4-th place with the following feedback:
A smooth and fast app. Applying filters to the final graph can be a little laggy on older devices (e.g., MotoX). Unfortunately, the app crashes when trying to scroll and apply filters at the same time. Also, 900 KB seems a bit bulky for this task.
The aforementioned final graph contained the largest number of elements, this is why it was laggy. This could be improved with a bitmap-caching mechanism.
As for the second issue ("the app crashes when trying to scroll and apply filters at the same time"), I couldn't reproduce it, but the app did crash for another reason (invalid deserializing when restoring state - by mistake I used Parcel.readLong() instead of Parcel.readInt()), so this could be the reported problem.
The third issue ("900 KB seems a bit bulky for this task") results from the fact that I used the support Android library. I had thought of removing it from the project, but in the end I decided that I should keep it for the next reasons:
- Without it (namely,
Toolbar), there's a nasty text flickering inActionBarwhen launching the app (on a moment it shows the app's label as set inManifestinstead of the title I assign; I decided not to reinvent the wheel or to use any tricky workarounds) - Without the library, on Android 4
Checkboxview has limited possibilities of styling (namely, it doesn't have tinting), which is important for design compliance.
Build 5 graphs based on the input data we provide. In addition to line charts developed in Stage 1, we are inviting developers to support 3 new chart types: line charts with 2 Y axes, bar charts and percentage stacked area charts.
This time the contest organizers decided to open all the apps for public testing. They created a platform https://contest.dev.
All the 286 apps submitted during the contest are now publicly available for review at https://contest.dev
During the next 7 days, everybody is welcome to find and report issues in the competing apps.
The developers have the opportunity to publicly reply to issues found in their apps.
To make the perception of the apps unprejudiced, each contestant has been assigned a random alias.
You can see all the feedback on this page https://contest.dev/chart-android/entry113.
This stage had very narrow time frame, so I couldn't polish everything. To sum up, the most important issues are:
- Invalid type of the 5-th graph (percentage stacked bars instead of percentage stacked area)
- Clipped filter-buttons
- Long-tap on filter not implemented (long tap on one filter should deselect all the other filters)
My app also got the 4-th place, which is a good result considering that it has the listed above issues and doesn't have the bonus task. I think, what's helped my app to win the 4-th place was its performance and conformity to the design guidelines.
Performance of the apps, measured on some popular devices, was an important factor that defined most of the winners. Other criteria taken into account were the completion of the bonus goal and conformity to the design guidelines. Slick animations and nice UI touches were also welcome.
I'd like to describe some problems that I was faced with during the development process.
Low performance when drawing with Path
At first I thought of Path as a perfect candidate for drawing graph lines as it can be easily transformed with Matrix. I also found out that I could crop left and right parts of a path that are not visible (using PathMeasure) in order to optimize drawings.
As it turned out, drawing with Path is very slow for my task. Here's an explanation from a developer from Google:
Paths are always rendered using the CPU. When the app is hardware accelerated this means the renderer will first draw your path using the CPU into a bitmap, then upload that bitmap as a texture to the GPU and finally draw the texture on screen.
Lines are entirely hardware accelerated. Instead of using aPathI recommend you useCanvas.drawLines()in this case.
So I ended up using a preallocated array of points with Canvas.drawLines() and performance improved considerably (frame rendering time stays under 16ms even on old devices). The question of cropping has also been resolved as Canvas.drawLines accepts offset and count params.
Color.TRANSPARENT not so transparent in gradients on Android < 26
In order to make a smooth cropping of a graph on the top when changing scale, every graph needed to have a simple gradient (from background color to transparent).
At first I used Color.TRANSPARENT and everything worked fine on my Android API 27 emulator. But I noticed, that on android < 26 the color was greyish.
It took me some time before I tried to calculate a transparent color based on background color (take the background color and change its alpha value). It worked.
In the end it became obvious why the things are like that. Since the value of Color.TRANSPARENT is 0, it means black with 0 alpha.
When using a gradient, it's interpolating between the background color and the black transparent color, this is how we get grayish colors in between.
There has to be a difference in code which is responsible for rendering gradients on Android >= 26, this is why I didn't see the grayish color on Android 27.
Empty rectangle areas when drawing with hardware acceleration on some devices
When showing the tooltip block with points information sometimes there was an empty rectangle above graphs. It could be an issue with HardwareComposer on this particular device (Asus Zenfone). As a quick fix I decided to disable hardware acceleration when showing tooltip.
Calculating and animating x-values
...


