-
Notifications
You must be signed in to change notification settings - Fork 547
Architecture
LinShunKang edited this page Jun 27, 2020
·
2 revisions
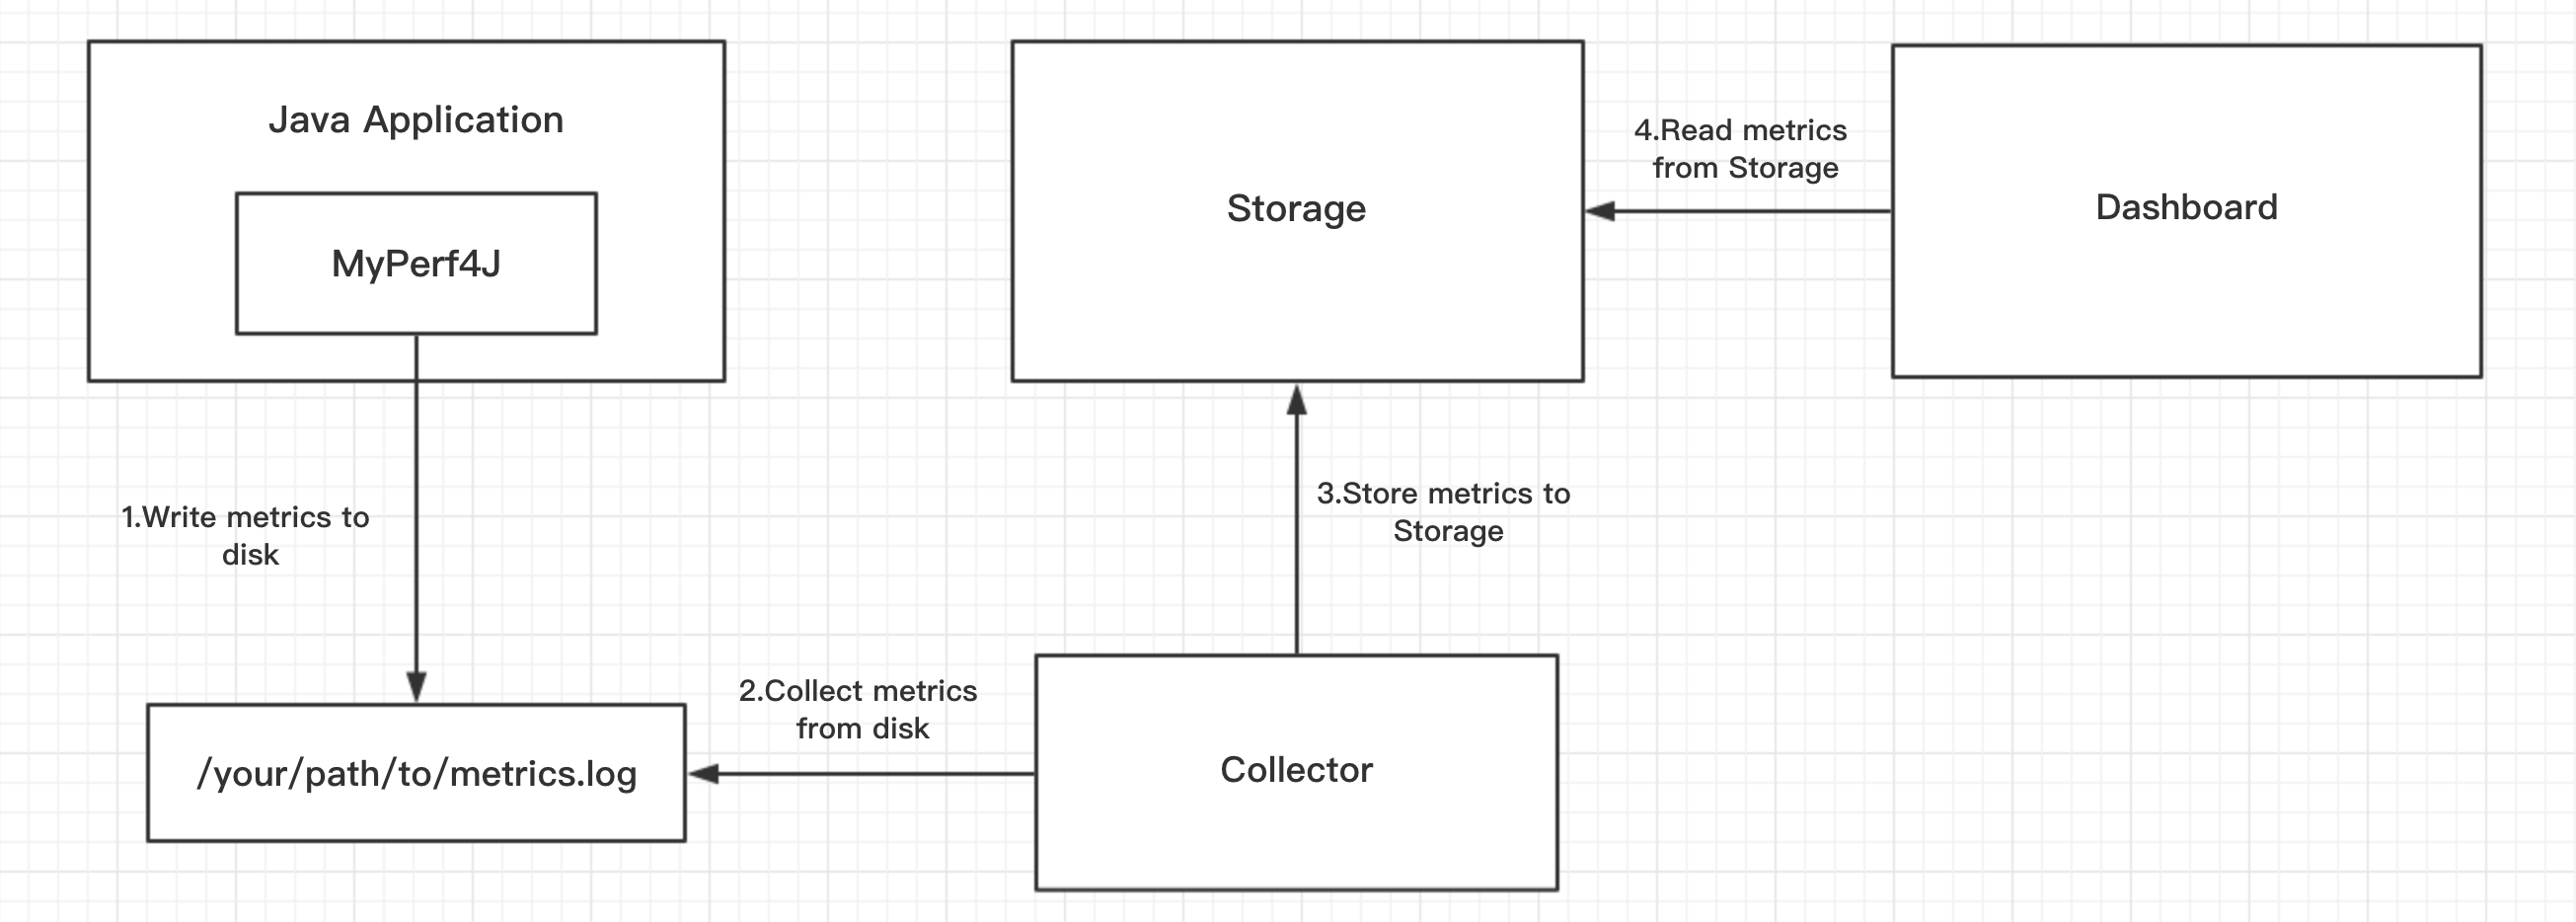
MyPerf4J supports two deployment structures:
- 3.x

- 3.x and before

Specification of Component's Role
| Component | Component Spec |
|---|---|
| Java Application | The container manages the services's lifetime |
| MyPerf4J | Metrics collection and statistics |
| Collector | Metrics log collector |
| Storage | Storage platform |
| Dashboard | Visualization platform |
Component relationship
- MyPerf4J periodically writes metrics in the specified time slice to the log file.
- Collector reads metrics from log files and writes them to Storage
- Dashboard reads data from Storage and displays it
Note, MyPerf4J** only provides **MyPerf4J itself, and the rest of the components need to be selected by the user. The advantages of doing this are as follows:
- Keep MyPerf4J streamlined
- Robustness, whether Collector, Storage or Dashboard crashed, does not affect data acquisition of MyPerf4J, nor does it lose data collected.
- Diversity, Collector can be Telegraf or Filebeat; Storage can be either InfluxDB or OpenTSDB; Dashboard can be Grafana or Chronograf.
* Home
- Chinese-Doc
-
English Doc
- MyPerf4J
- Time Series Database
- Log Collector
- Visualization Platform