A Leaflet plugin to view an interactive height profile of polylines lines using d3. Currently Chrome and Firefox are supported and tested. This plugin is under development.
Support for
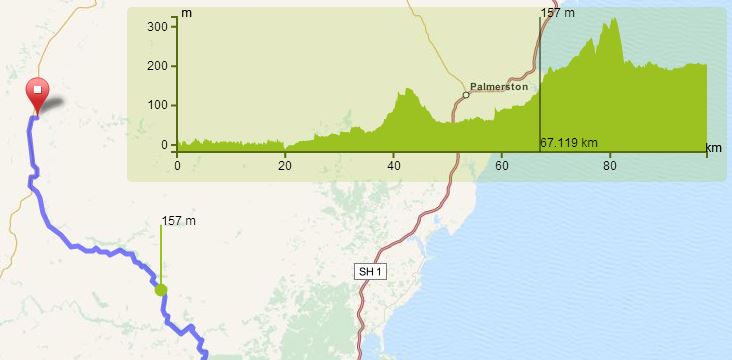
- GeoJSON Demo
- GPX-files using leaflet-gpx Demo
Tested with Leaflet 0.4+
//all used options are the default values
var el = L.control.elevation({
  	position: "topright",
	theme: "steelblue-theme", //default: lime-theme
	width: 600,
	height: 125,
	margins: {
		top: 10,
		right: 20,
		bottom: 30,
		left: 50
	},
	useHeightIndicator: true, //if false a marker is drawn at map position
	interpolation: "linear", //see https://github.com/mbostock/d3/wiki/SVG-Shapes#wiki-area_interpolate
	hoverNumber: {
		decimalsX: 3, //decimals on distance (always in km)
		decimalsY: 0, //deciamls on height (always in m)
		formatter: undefined //custom formatter function may be injected
	},
	xTicks: undefined, //number of ticks in x axis, calculated by default according to width
	yTicks: undefined //number of ticks on y axis, calculated by default according to height
});
el.addTo(map);
L.geoJson(geojson,{
    onEachFeature: el.addData.bind(el) //working on a better solution
}).addTo(map);
var el = L.control.elevation();
el.addTo(map);
var g=new L.GPX("./mytrack.gpx", {async: true});
g.on("addline",function(e){
el.addData(e.line);
});
g.addTo(map);