-
Notifications
You must be signed in to change notification settings - Fork 25
example_fourDimensions
Almar Klein edited this page Jun 1, 2017
·
7 revisions

#!/usr/bin/env python
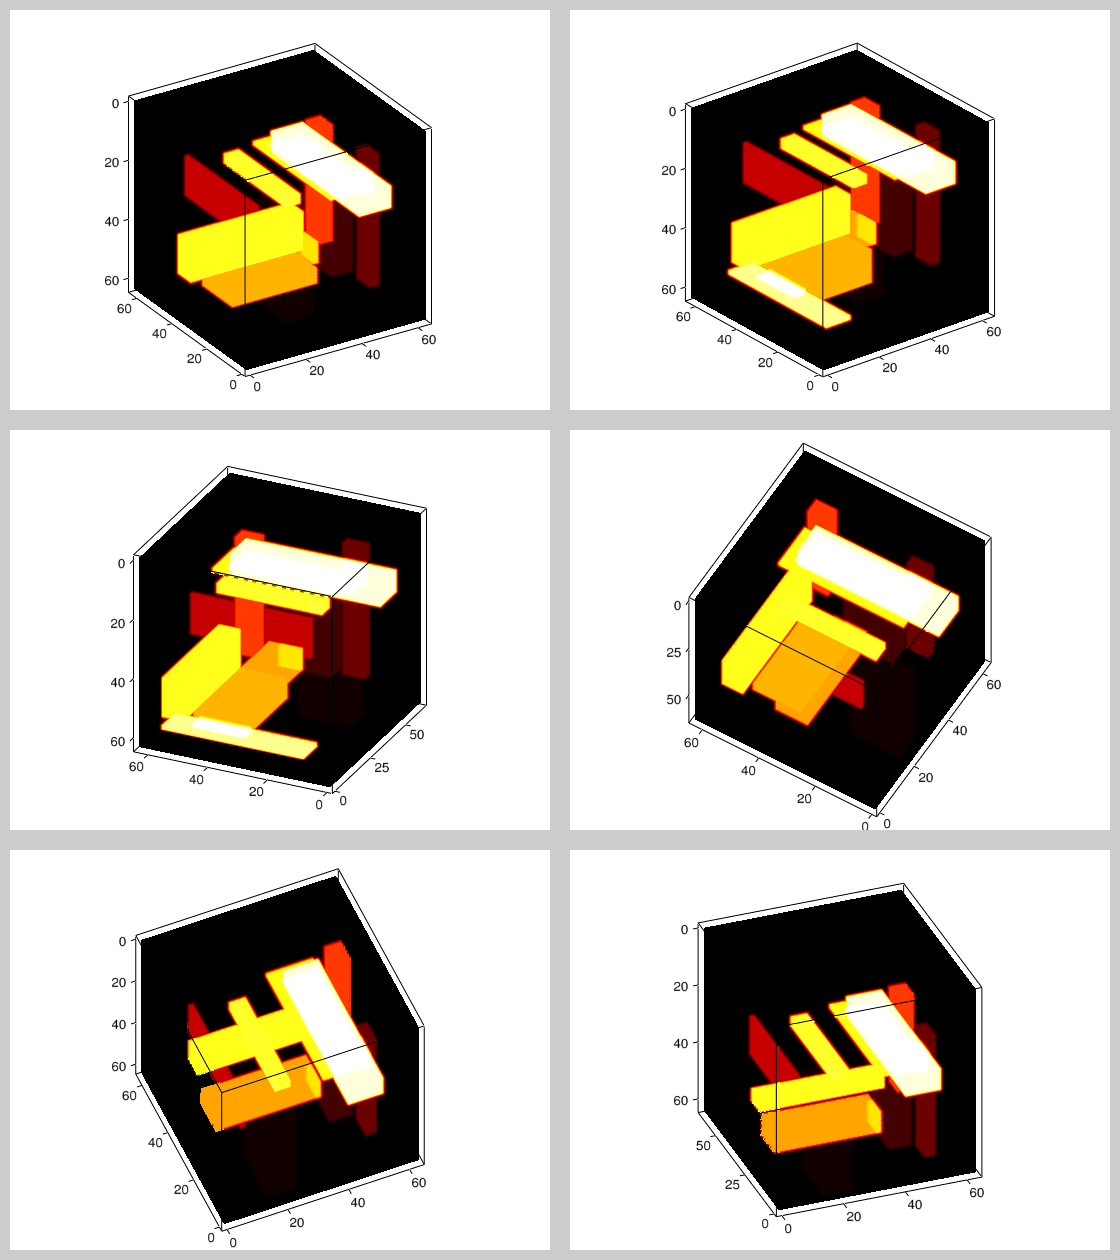
""" This example illustrates visualizing a four dimensional data set
(a series of 3D volumes). The same method can be used to visualize
the motion of lines, images, meshes, etc.
"""
import visvis as vv

# create multiple instances of the same volume (simulate motion)
vols = [vv.aVolume()]
for i in range(9):
    vol = vols[i].copy()
    vol[2:] = vol[:-2]
    vol[:2] = 0
    vols.append(vol)

# create figure, axes, and data container object
f = vv.clf()
a = vv.gca()
m = vv.MotionDataContainer(a)

# create volumes, loading them into opengl memory, and insert into container.
for vol in vols:
    t = vv.volshow(vol)
    t.parent = m
    t.colormap = vv.CM_HOT
    # Remove comments to use iso-surface rendering
    #t.renderStyle = 'iso'
    #t.isoThreshold = 0.2

# set some settings
a.daspect = 1,1,-1
a.xLabel = 'x'
a.yLabel = 'y'
a.zLabel = 'z'

# Enter main loop
app = vv.use()
app.Run()