dataZoom does not align if xAxis is "time" #16980
Description
Version
5.3.2
Link to Minimal Reproduction
https://codepen.io/s3cp/pen/VwQLVzp
Steps to Reproduce
Create a time series where the data are not evenly distributed.
var dom = document.getElementById('chart-container');
var myChart = echarts.init(dom, null, {
  renderer: 'canvas',
  useDirtyRect: false
});
var app = {};

var option;

let base = +new Date(1988, 9, 3);
let oneDay = 24 * 3600 * 1000;
let tenDay = 24 * 3600 * 1000 * 10;
let data = [[base, Math.random() * 300]];

// add 100 numbers in first half
for (let i = 1; i < 100; i++) {
  let now = new Date((base += oneDay));
  data.push([+now, Math.round((Math.random() - 0.5) * 20 + data[i - 1][1])]);
}

// add ten numbers in second half
for (let i = 1; i < 10; i++) {
  let now = new Date((base += tenDay));
  data.push([+now, Math.round((Math.random() - 0.5) * 20 + data[i - 1][1])]);
}

// data now not evenly distributed

option = {
  tooltip: {
    trigger: 'axis',
    position: function (pt) {
      return [pt[0], '10%'];
    }
  },
  title: {
    left: 'center',
    text: 'Large Ara Chart'
  },
  toolbox: {
    feature: {
      dataZoom: {
        yAxisIndex: 'none'
      },
      restore: {},
      saveAsImage: {}
    }
  },
  dataZoom: [
    {
      type: 'inside',
      start: 0,
      end: 100
    },
    {
      start: 0,
      end: 100
    }
  ],
  xAxis: {
    type: 'time',
    boundaryGap: false
  },
  yAxis: {
    type: 'value',
    boundaryGap: [0, '100%']
  },

  series: [
    {
      name: 'Fake Data',
      type: 'line',
      smooth: false,
      symbol: 'none',
      areaStyle: {},
      data: data
    }
  ]
};

if (option && typeof option === 'object') {
  myChart.setOption(option);
}

window.addEventListener('resize', myChart.resize);
Example: https://codepen.io/s3cp/pen/VwQLVzp
Current Behavior
The dataZoom area shows the data by index, not by time.
Expected Behavior
For the dataZoom area to show the data by time.
Environment
- OS: All
- Browser: All
- Framework: None.
Any additional comments?
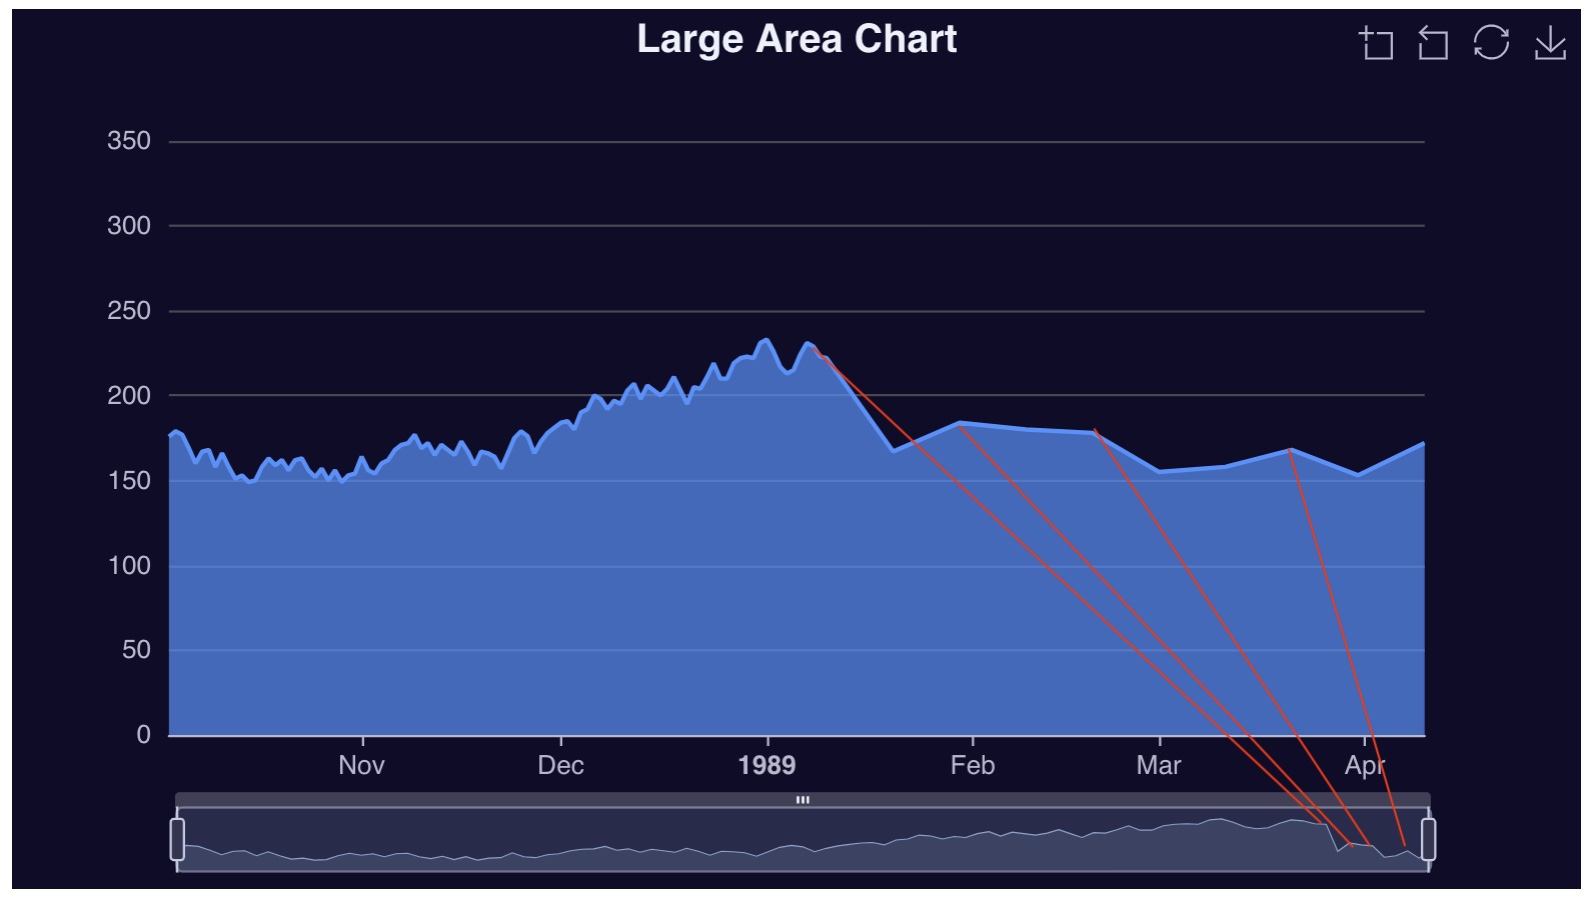
The dataZoom area is full width, but the peaks do not line up with the actual graph.