[Bug] DataZoom doesn't represent correctly multi series charts #17487
Description
Version
5.3.3
Link to Minimal Reproduction
Steps to Reproduce
Replace the example with the following snippet:
option = {
  tooltip: {
    trigger: "axis"
  },
  xAxis: {
    data: ["2014-07-14", "2014-07-15", "2014-07-16", "2014-07-17", "2014-07-18", "2014-07-19", "2014-07-20", "2014-07-21", "2014-07-22", "2014-07-23", "2014-07-24", "2014-07-25", "2014-07-26", "2014-07-27", "2014-07-28"]
  },
  yAxis: {
    splitLine: {
      show: false
    }
  },
  dataZoom: [{}],
  legend: {
    show: true
  },
  series: [

    {
      name: "Carrots",
      type: "line",
      itemStyle: {
        color: "rgba(83, 63, 123, 0.75)"
      },
      data: [1, 2, 3, 4, 5, 6, null, null, null, null, null, null, null, null, null]
    },
    {
      name: "Potato",
      type: "line",
      itemStyle: {
        color: "rgba(255, 125, 35, 0.75)"
      },
      data: [null, null, null, null, null, 6, 7, 8, 9, 10, 11, 12, 13, 14, 15]
    },
  ]
}
Current Behavior
The data zoom shows one of the 2 lines within the minimap
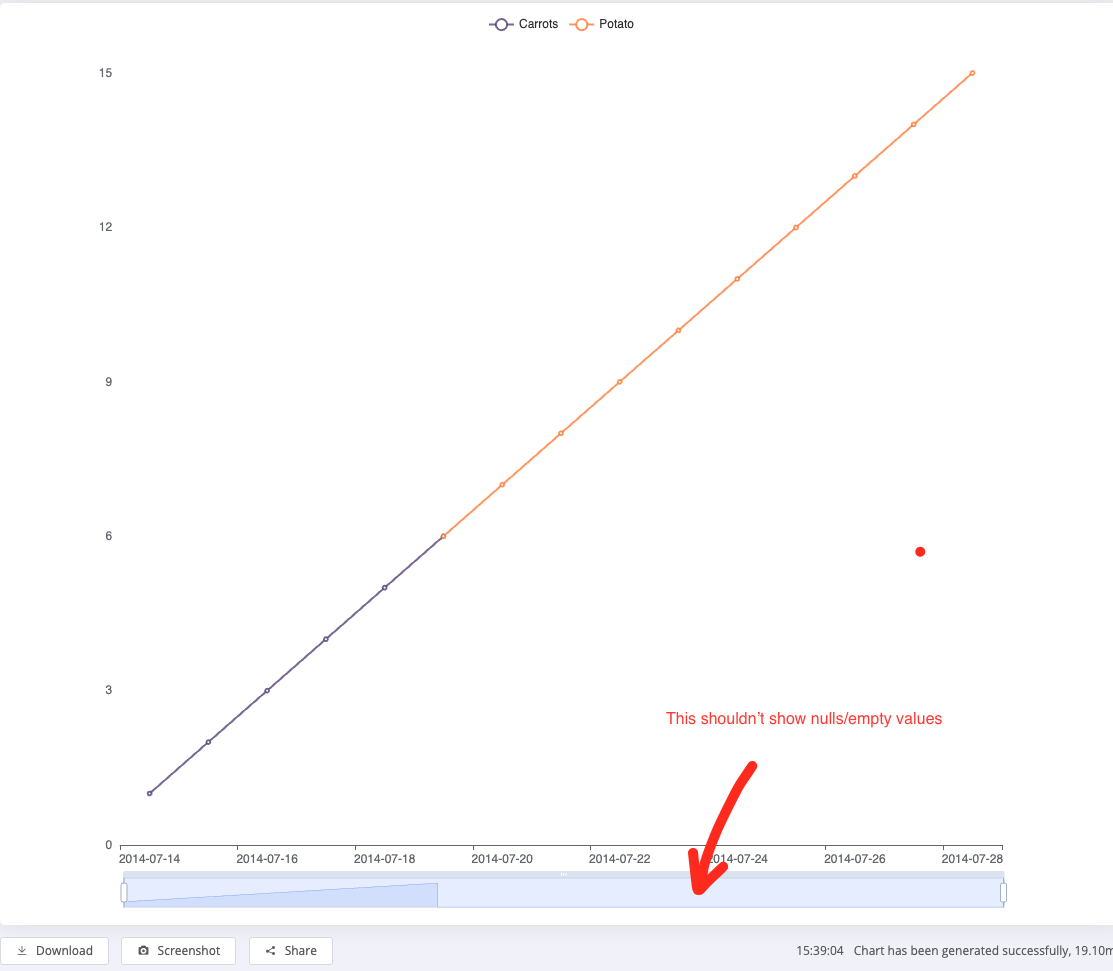
Expected Behavior
The data zoom should show the shape of both of the lines as it looks completely wrong
Environment
- OS: n/a
- Browser: n/a
- Framework: n/a
Any additional comments?
No response