-
Notifications
You must be signed in to change notification settings - Fork 155
Design Doc: PSOL Console
Shawn Ligocki, 2013-03-07
The PSOL Console will be a webmaster-facing website that brings together all information that we’d like to let webmasters know about their PSOL installation: health, effectiveness, tips, etc.
The initial motivation is to provide actionable feedback to webmasters on what they can do to make PSOL more effective on their site (enabling more domains, using longer Cache-Control headers, etc.).
This is especially wanted so that webmasters who sign up for MPS and don’t get an improvement by default will have some help in digging deeper and getting the best performance out of PSOL.
Our interns in CAM last summer built most of the pieces for a MPS Console that presented graphs for all of our Variables. The intent was that this could be augmented to adding other information, like common CSS files which had errors, etc.
My intention is to complement this by adding a landing page which will list actionable problems that make us less effective.
Similar to the current /mod_pagespeed_statistics page, this would be a webpage run off the MPS server using an Apache handler. Users would have to use Apache configuration to decide how to expose it (to whitelisted IPs, using HTTP authorization, etc.)

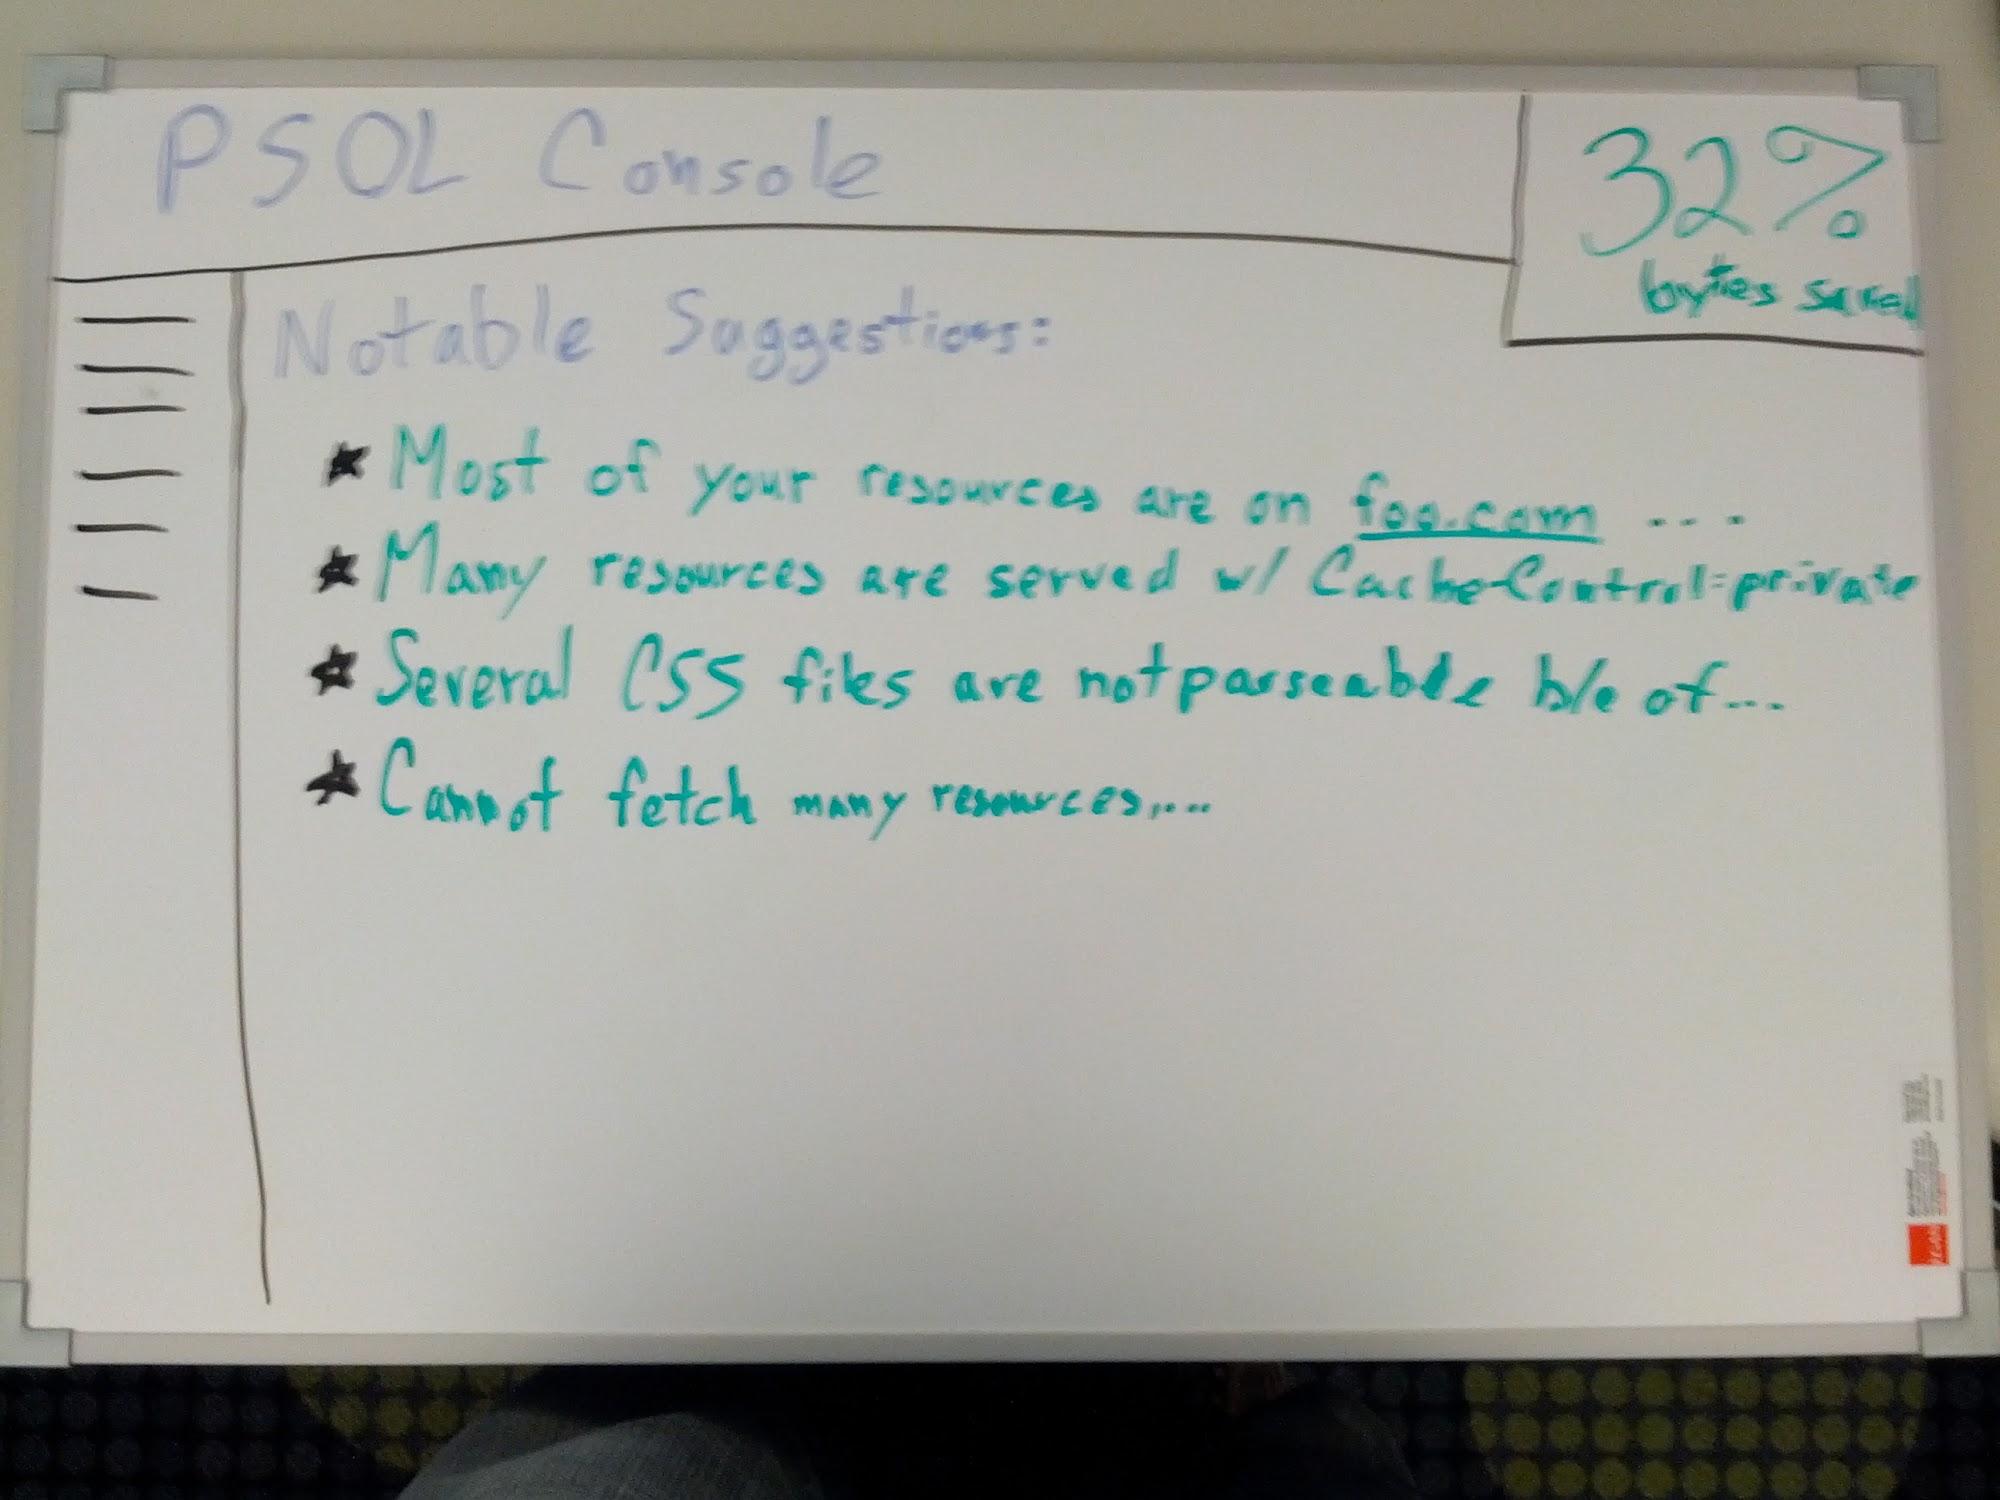
Basic layout:
- Main start page summarizes notable suggestions:
- Clicking on each item explains it and suggests how to fix it.
- Examples:
- Note domains your resources are on that aren’t enabled for rewriting.
- Note limitations because of Cache-Control, Vary or other headers.
- Note common resources that couldn’t be rewritten and reasons (constructs not understood in CSS, etc.)
- Note filters they might benefit from enabling.
- Links on left bar to different expanded sections:
- graphs
- Metrics
- Perhaps a full page for each notable suggestions, so that even if we don’t prioritize some to the main summary, they can still dig down into them.
- [Stretch] Prominent metric in upper right to show how well we’re doing. We will not focus on this initially, both because it is extra work that is not needed to help users and because we don’t necessarily have a useful metric to provide users at the moment.
- Filters (and perhaps other infrastructure) need to start identifying reasons for failures or shortcomings in rewriting.
- These will be logged into LogRecord (perhaps in the RewriterApplicationStatus field) and these results will be logged at the end of the request.
- We will need to implement LogRecord::WriteLog(), which is currently a no-op in MPS.
- The console needs to be able to pull this data up from the logs, compile it, prioritize which errors are most important to the user and link each error to actionable feedback.
I expect (3) and (4) to be the most technically challenging among these. While (1) and (2) can hopefully be load-balanced among filter writers.
First step is to log data to a file as serialized protobufs or something similar. We’ll need to resurrect the ModPagespeedFilePath or something similar to have a directory to put these files in.
To avoid storing too much data, we’ll rotate files with a max size: For example we log into foo.log.1 until it is 1/10 * max_log_size, then we rotate logs, move foo.log.9 -> foo.log.10, foo.log.8 -> foo.log.9, … foo.log.1 -> foo.log.2. foo.log.10 gets overwritten, so we always have 10 logfiles and thus enforce a max log size.
When webmaster accesses console, it compiles the data and prioritizes which errors to show in which order. For example, first run will probably prioritize simply by which issues caused the most resources to not be rewritten.
Optimizations: Pre-compile the information (perhaps during log rotation)