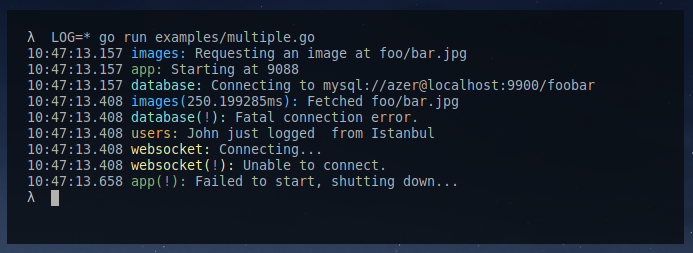
Minimalistic logging library for Go. Features:
- Advanced output filters (package and/or level)
- Attributes
- Timers for measuring performance
- Structured JSON output
- Programmatical Usage
- Hooks
- Being used in production since 2014.
$ go get github.com/azer/loggerCreate an instance with a preferred name;
import "github.com/azer/logger"

var log = logger.New("example-app")
Every logger has three methods: Info, Timer and Error.
log.Info("Running at %d", 8080)

err := DoSomething()

if err != nil {
  log.Error("Failed: %s", err.Error())
}
Done. Now run your app, passing LOG=* environment variable. If you don't pass LOG=*, (logging will be silent by default);
$ LOG=* go run example-app.go
01:23:21.251 example-app Running at 8080
You can filter logs by level, too. The hierarchy is; mute, info, timer and error.
After the package selector, you can optionally specify minimum log level:
$ LOG=*@timer go run example-app.go
01:23:21.251 example-app Running at 8080
The above example will only show timer and error levels. If you choose error, it'll show only error logs.
Check out examples for a more detailed example.
You can enable all logs by specifying *:
$ LOG=* go run example-app.goOr, choose specific packages that you want to see logs from:
$ LOG=images,users go run example-app.goIn the above example, you'll only see logs from images and users packages. What if we want to see only timer and error level logs?
$ LOG=images@timer,users go run example-app.goAnother example; show error logs from all packages, but hide logs from database package:
$ LOG=*@error,database@mute go run example-app.goYou can use timer logs for measuring your program. For example;
timer := log.Timer()

image, err := PullImage("http://foo.com/bar.jpg")

timer.End("Fetched foo.com/bar.jpg")
Timer log lines will be outputting the elapsed time in time.Duration in a normal terminal, or in int64 format when your program is running on a non-terminal environment. See below documentation for more info.
When your app isn't running on a terminal, it'll change the output in JSON:
{ "time":"2014-10-04 11:44:22.418595705 -0700 PDT", "package":"database", "level":"INFO", "msg":"Connecting to mysql://azer@localhost:9900/foobar" }
{ "time":"2014-10-04 11:44:22.418600851 -0700 PDT", "package":"images", "level":"INFO", "msg":"Requesting an image at foo/bar.jpg" }
{ "time":"2014-10-04 11:44:22.668645527 -0700 PDT", "package":"images", "level":"TIMER", "elapsed":"250032416", "msg":"Fetched foo/bar.jpg" }
{ "time":"2014-10-04 11:44:22.668665527 -0700 PDT", "package":"database", "level":"ERROR", "msg":"Fatal connection error." }
So you can parse & process the output easily. Here is a command that lets you see the JSON output in your terminal;
LOG=* go run examples/simple.go 2>&1 | less
To add custom attributes to the structured output;
log.Info("Sending an e-mail...", logger.Attrs{
  "from": "foo@bar.com",
  "to": "qux@corge.com",
})
The above log will appear in the structured output as:
{ "time":"2014-10-04 11:44:22.919726985 -0700 PDT", "package":"mail", "level":"INFO", "msg":"Sending an e-mail", "from": "foo@foobar.com", "to": "qux@corge.com" }In your command-line as:
Customizing the default behavior is easy. You can implement your own output;
import (
  "github.com/azer/logger"
)

type CustomWriter struct {}

func (cw CustomWriter) Write (log *logger.Log) {
  fmt.Println("custom log -> ", log.Package, log.Level, log.Message, log.Attrs)
}

func main () {
  logger.Hook(&CustomWriter{})
}
See examples/programmatical.go for a working version of this example.
- Slack: Stream logs into a Slack channel.

