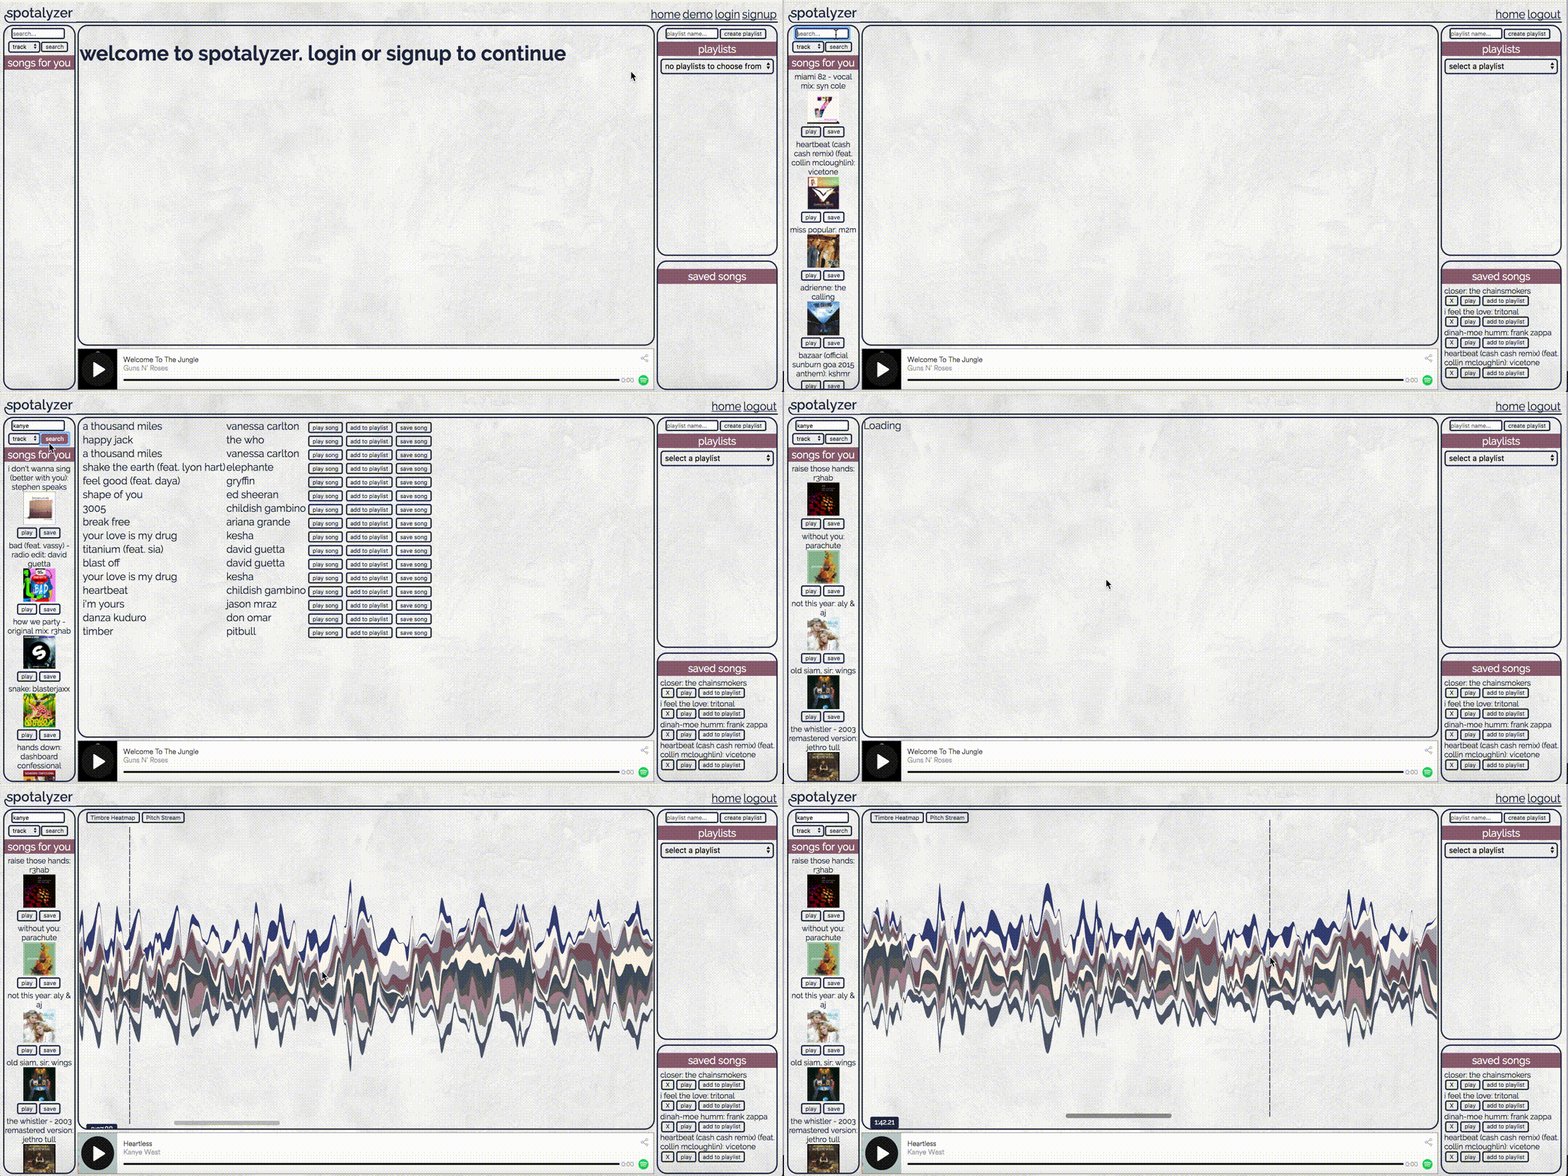
A web app for the Spotify API with data visualization of currently playing music.
- Homepage - Main page, click demo to login
- Data Visualization Demo - Click here to get sent to a sample data visualization page
Note: Heroku takes a bit to load up the first time and both the frontend and backend need to be loaded
Most Spotify functions are available. Search for songs, manage playlists. Update playlists on Spotify. Save songs for later. You can login with the demo account, or create your own account and link it to your spotify.
Data visualization is done using VX and D3. Spotify API gives access to all this song data. The stack chart is the pitches of the song from a scale of 0 to 1. There are twelve pitches at all points in time, and spotify analysis divides them into durations of seconds. The timbre heatmap is also available. Timbre is divided into the same 12 pitches and durations, however, the value of timbre is more like the quality of the sound. An F note coming from a trumpet or a violin have a different quality to them.
- Frontend - frontend built in react and redux
- Backend - backend built in rails. Most data comes from the Spotify API, but local data is stored to improve loading times
Clone both github frontend - npm install backend - bundle install
src/components/data/environment.js should be modified to the address of your backend
Spotify authorization is a bit of a mess, here's a rundown of what will need to be modified prepared
Set up your Spotify api key on Spotify.com modify src/components/data/auth_url.js with the correct information to redirect to your spotify application authorization page set up callbacks on Spotify.com that redirect back to your front end. ({front-end web address}/callback)
Add additional notes about how to deploy this on a live system
- React - The web framework used
- VX - A library that connects react and D3
- [Redux] - Frontend
- [Rails] - Backend
- Joe Cha - Initial work - bother7
This project is licensed under the MIT License - see the LICENSE.md file for details
