Performance optimization
The following procedure will be used to optimize OpenBlack.
- Determine the optimization goals.
- Profile to determine bottlenecks.
- Apply high-level optimizations(typically: those that reduce algorithmic complexity) to the bottlenecks.
- Profile again.
- Apply vectorization, GPGPU, and/or multi-threading, if applicable.
- Profile.
- Apply low-level optimizations.
- Repeat steps 5 and 6 until time runs out.
- Report.
My development platform is running the Linux kernel version 5.3.6 on Arch Linux. My screen has a 1920x1080 resolution running at 144Hz. My processor is an Intel Core i7-8750H @ 12x 2.2GHz and my graphics card is GeForce GTX 1070 with Max-Q Design. My system has 32 GB of DDR4 memory at 2666MHz and 2 TB of SSD.
I will be running OpenBlack in RelWithDebInfo configuration with the OpenGL backend at full screen resolution with vsync disabled. I am interested in the runtime performance on the main thread during the game loop. Mainly the perceived FPS of the game. For linear scaling, I will be focusing on the ms duration of one frame. The metric is taken from the loop in Game::Run().
The displayed performance for each level is as follows:
| Level | Block Count | Submitted Draw Calls | Triangles | Frame Time |
|---|---|---|---|---|
| 1 | 100 | 7701 | 221550 | 9.30 |
| 2 | 138 | 6631 | 255934 | 8.30 |
| 3 | 94 | 7639 | 227450 | 8.61 |
| 4 | 149 | 5463 | 217384 | 7.99 |
| 5 | 187 | 6475 | 267226 | 9.97 |
| T | 63 | 2599 | 99360 | 4.63 |
| 2P | 53 | 2167 | 93330 | 2.63 |
| 3P | 104 | 5919 | 181674 | 7.81 |
| 4P | 112 | 4473 | 187628 | 4.95 |
From this table, the level 5 is clearly the level which is most affected by scene complexity (highest number of blocks, highest amount of triangles drawn and high number of draw calls) and the frame time of almost 10 ms shows. By contrast, the 2P level having a lower scene complexity (lowest amount of blocks, draw calls and triangles) is running at 2.6 ms.
My first optimization goal is to have level 5 run at my screen's refresh rate, which means aiming for 7ms. My second optimization goal is to bring the rendering of level 5 as close to that of 2P as possible, around 3ms.
OpenBlack has a basic reporting of frames frequency and duration rendered with Dear ImGui[1]. While this is nice, it does not supply sufficient information about bottlenecks and how a frame's time is split up. I could use an external tool such as perf or Intel's Vtune to analyze hotspots but these external tools require running and stopping the application and tend to be better suited for low-level optimization.
A better solution is adding an in-game profiler. To prevent too much of an observer's effect, I opted for a constant sized array for my profiler design, avoiding any dynamic allocation (e.g. maps, vectors). This means that any time recording must be unique and must be statically declared before hand. Since OpenBlack's passes are static, this is not a problem implementing.
Visualizing the data is done with ImGui Text for durations. For better perspective, a flame graph [2] would be ideal. While many ImGui implementations of flame graphs widgets exist, there was none for which source was available. I took the time to write one of my own and publish it under an open source license [3].
Armed with this new widget, I profiled the game loop for both the CPU and the GPU frame.
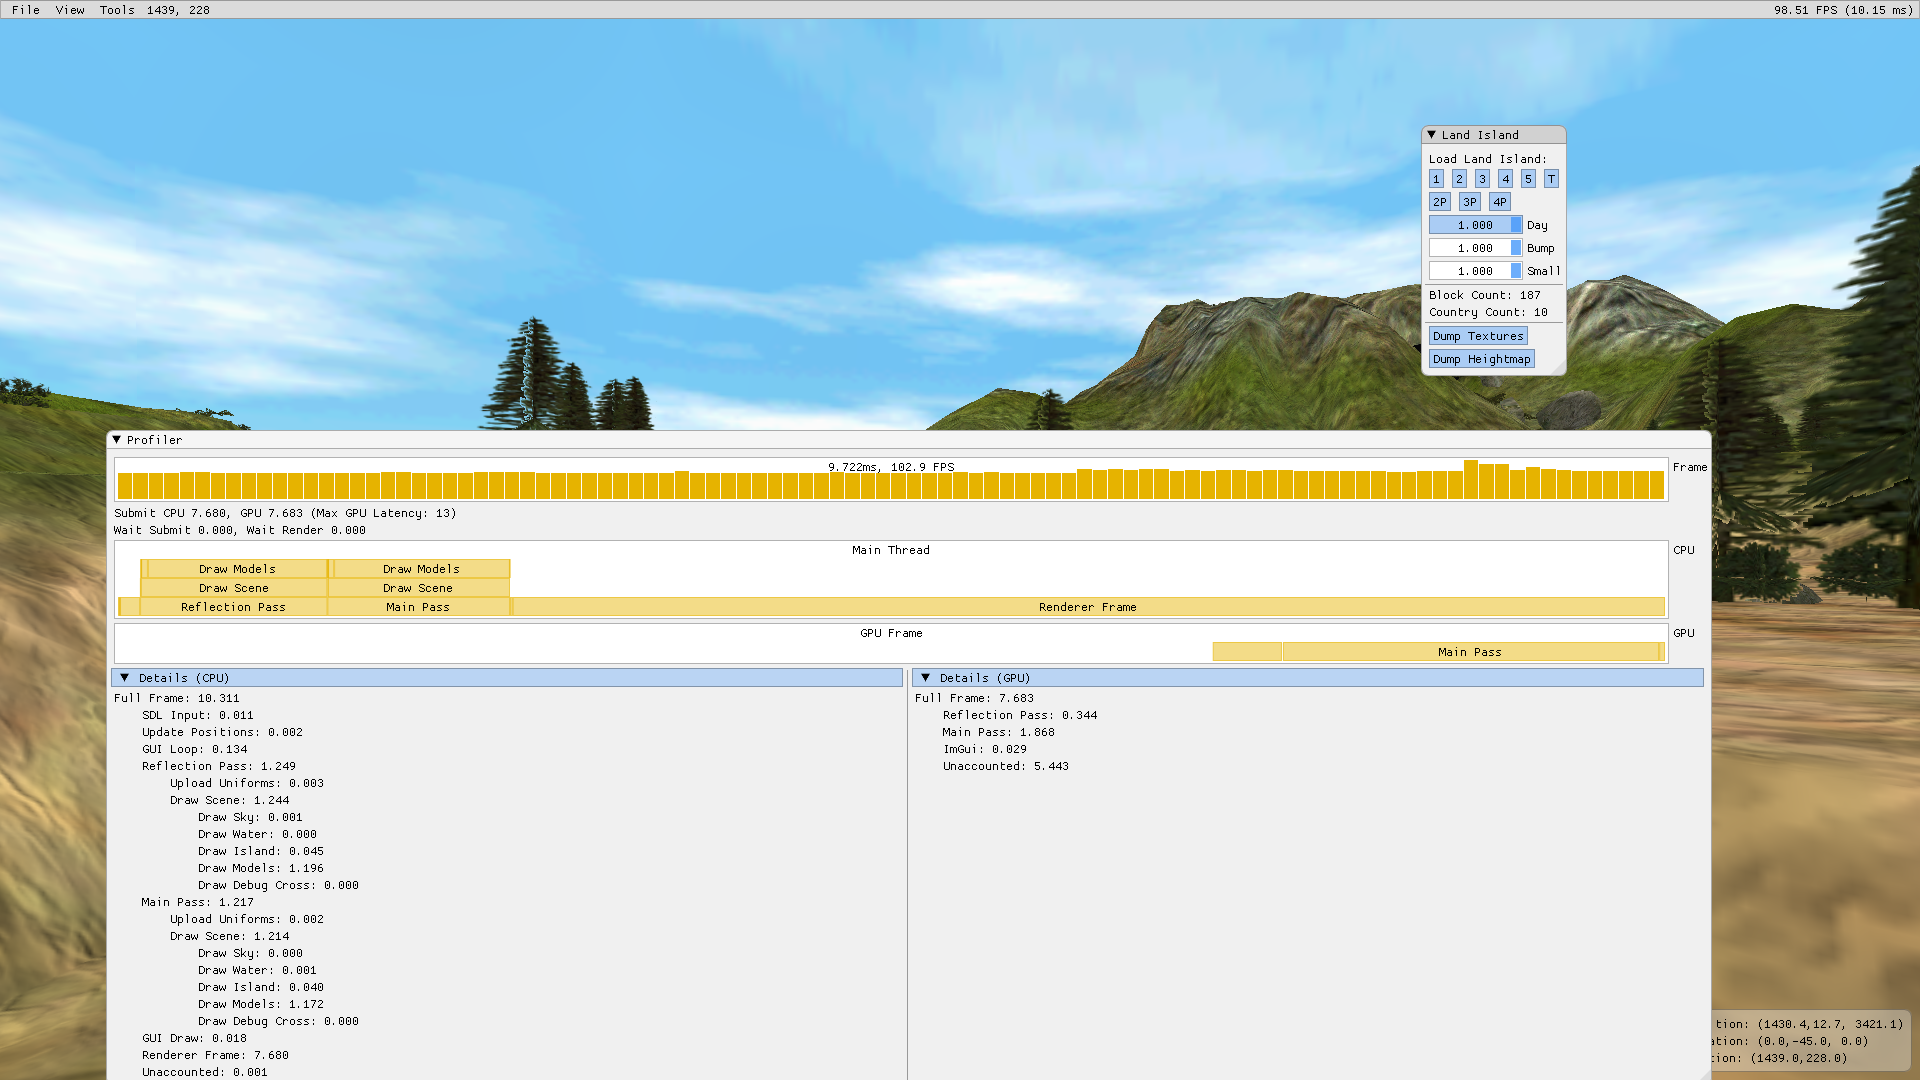
As we can see, the CPU render loop is single-threaded and has a sync point with the GPU in Render Frame (7.680 ms). This is the lion's share of the loop so for the moment, we will ignore the other sections in the CPU frame.
In the GPU Frame which runs for about the same duration as Render Frame, we have the passes running for under 2.5ms. There is a large missing section which seems to suggest that there's a synchronization issue.
The issue was actually from the rendering library, bgfx [4], which is missing vital information about CPU-GPU upload. As it happens, the game is destroying and re-crating vertex buffers at each frame.
All geometry in the scene is static except for the geometry of the UI. The first optimization to be done is to eliminate this recreation of buffers on each frame. The vertex data should be uploaded once at scene load and left up for the rest of the rendering duration for static geometry. For UI geometry, conservative recreation should be done.
The bgfx library has three types of index and vertex buffers:
- static: create and upload once in device read-only VRAM.
- dynamic: create once and upload whenever in host-shared read-write VRAM.
- transient: re-created and uploaded every frame.
Transient buffers are a higher-level rendering library construct. They exist to make programming easier. Their purpose is to make fetching a temporary buffer easy and have no need for user to manage them. They request a buffer in one frame and they get a handle. Behind the scenes, bgfx stores all transient data in a bgfx-managed buffers. If at least one has been requested, bgfx will refresh the buffer and use it during rendering. The size of the transient buffer can be configured at initialization. The default size of transient buffers is 6 MiB for Vertices and 2 MiB for Indices. With the all windows opened, ImGui needs less than 6000 vertices of size 20 B which is about 2% of the size of the transient buffer.
For such a small amount of data to cause the GPU to destroy and recreate a buffer every frame, it is quite wasteful as allocations of memory are not quick on a GPU.
The first step I took is to merge all the transient buffer uses into one large buffer which can use offsets for both vertices and indices. This way, only one buffer needs to be recreated when the size needed changes (e.g. a new window spawns).
I removed the use of transient buffers in the bgfx-imgui code and made use of a dynamic buffer. Vertex data still gets uploaded every frame, which is needed for things such as wigdet plots, moving windows and changing text.
The UI code keeps track of the needed space to draw the entire ui. With this, the dynamic buffer will resize (thus recreating the buffer) only if there is not enough space. The buffer will not shrink as this would be too expensive. Ideally, we would precalculate the maximum size of UI given the permutations of the menus but this would sacrifice too much usability for the sake of a small reduction in jitter (spikes in single frames).
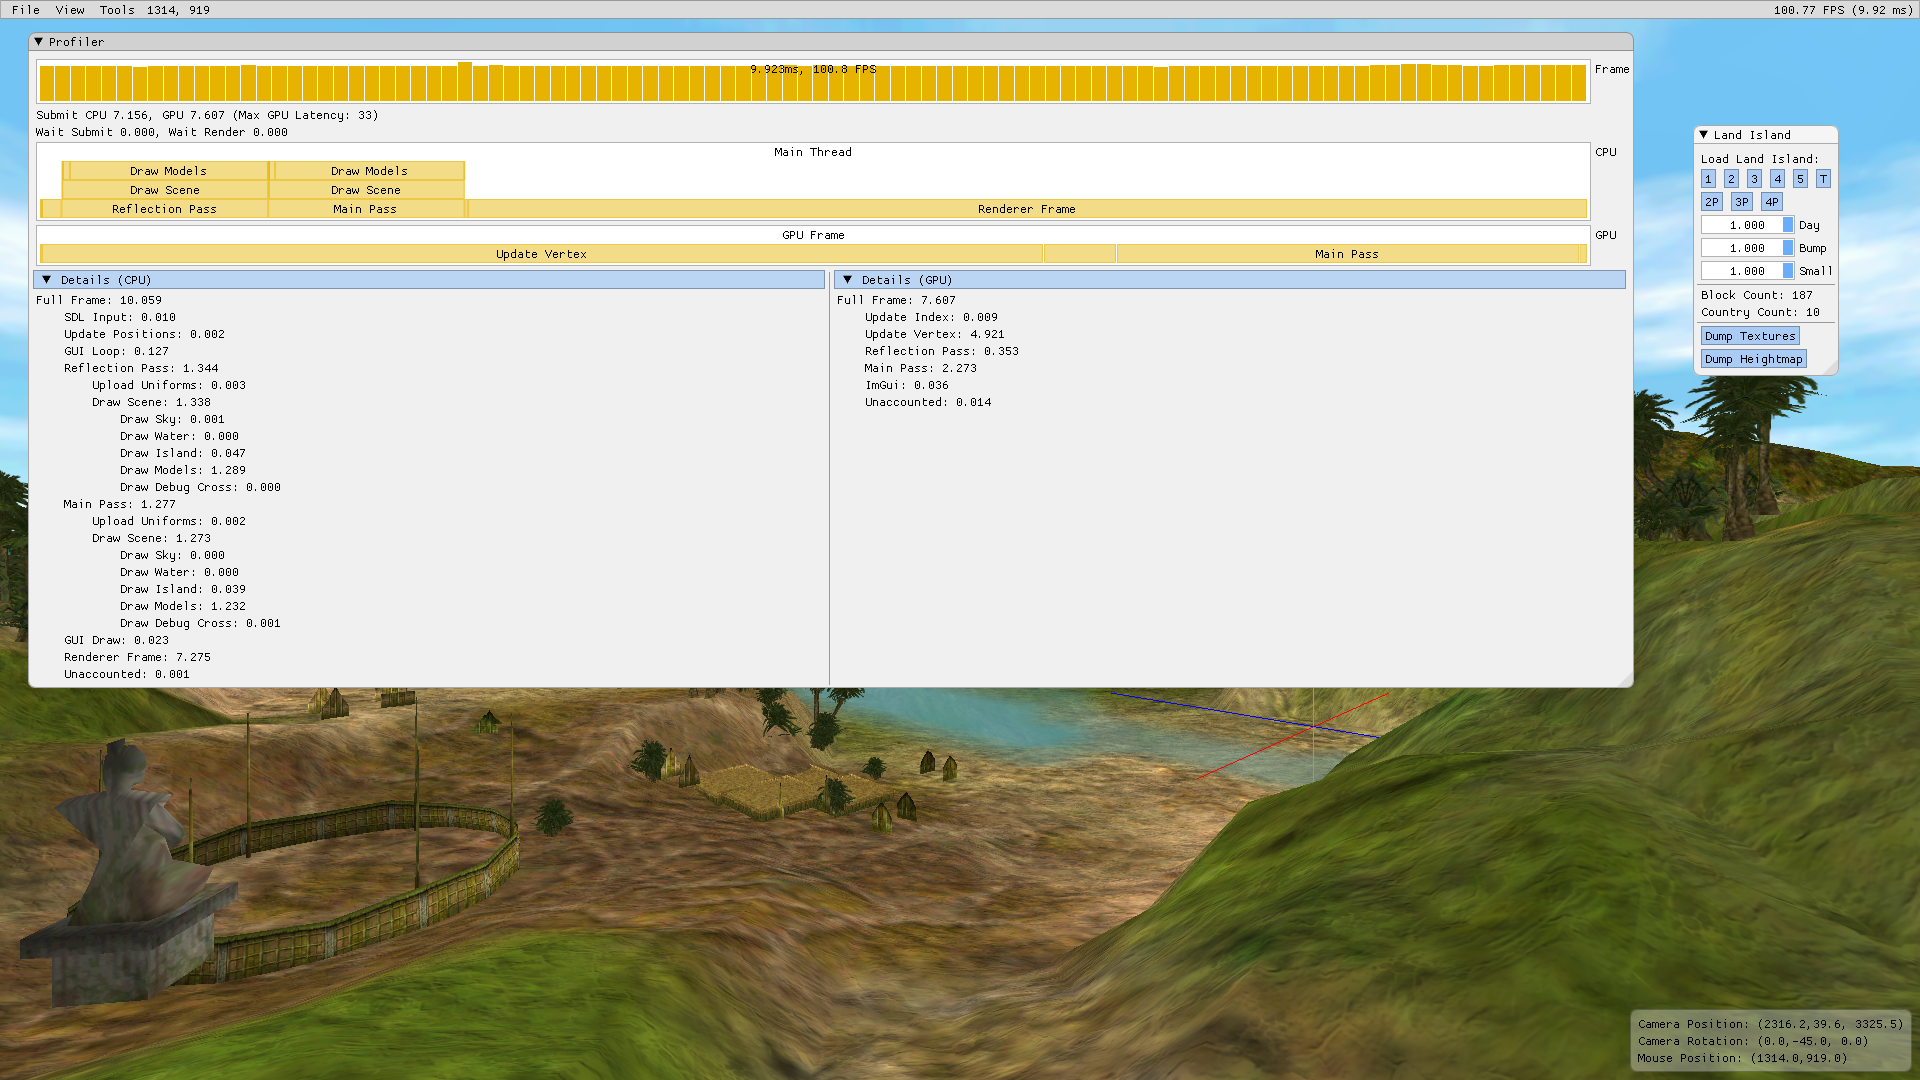
The result is that the UI buffers no longer recreate every frame and the time spent there disappears in the GPU profiler.
The result is somewhat unexpected: The GPU time goes down with the elimination of the time spent recreating a 20 MiB vertex buffer and uploading data to it, but the frame time stays about the same.
It turns out that the Vertex upload was hiding latency on the host side. We can see clearly that the time of CPU-side "Render Frame" is no longer close to equal to the GPU full frame time. It is now taking about 3 times longer than the GPU frame. This is our new bottle neck as it is clear that the GPU is underutilized.
That being said, I proposed the changes to the upstream project [5].
We now have a big block in "Render Frame" taking about 3/4 the time of a frame and the assumption that it was waiting on the CPU is proven wrong.
More detail is added to the function calls within "Render Frame" which is in fact encompassing a call to bgfx::frame(). The bgfx library already records a lot of performance statistics, but usually encodes them as durations instead of time points.
A small modification to bgfx was gather more information of "Submit CPU", a metric already used in the profiler but now with start and end times. The same was done for view (render passes) stats. And finally, the presorting bgfx does before enqueuing commands to the GPU was profiled.
Additional performance stats were added such as use of dynamic and transient buffers and more importantly: the number of primitives rendered and draw calls dispatched.
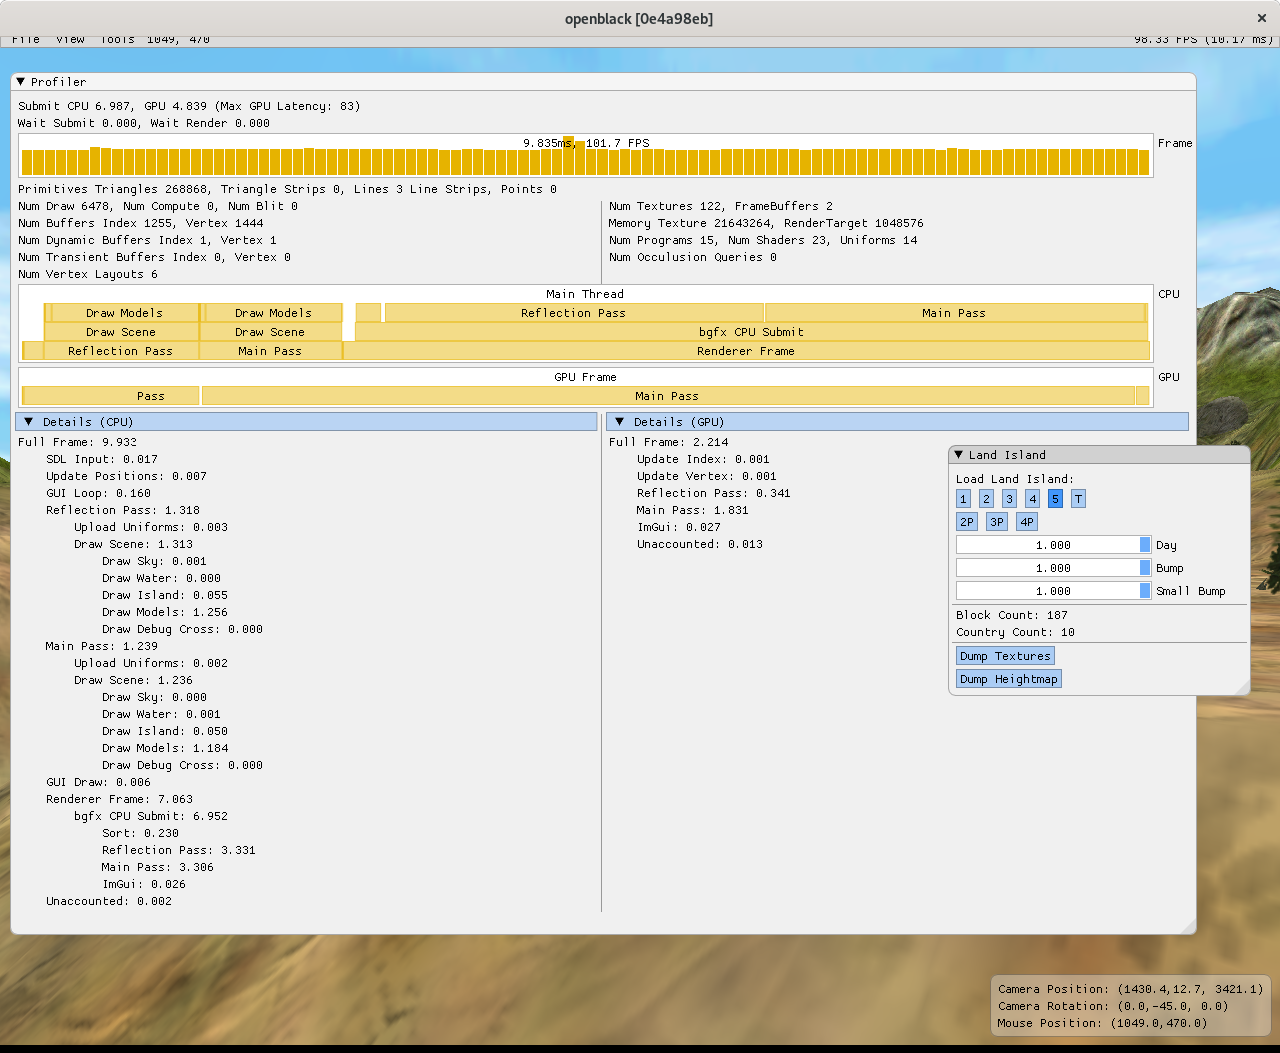
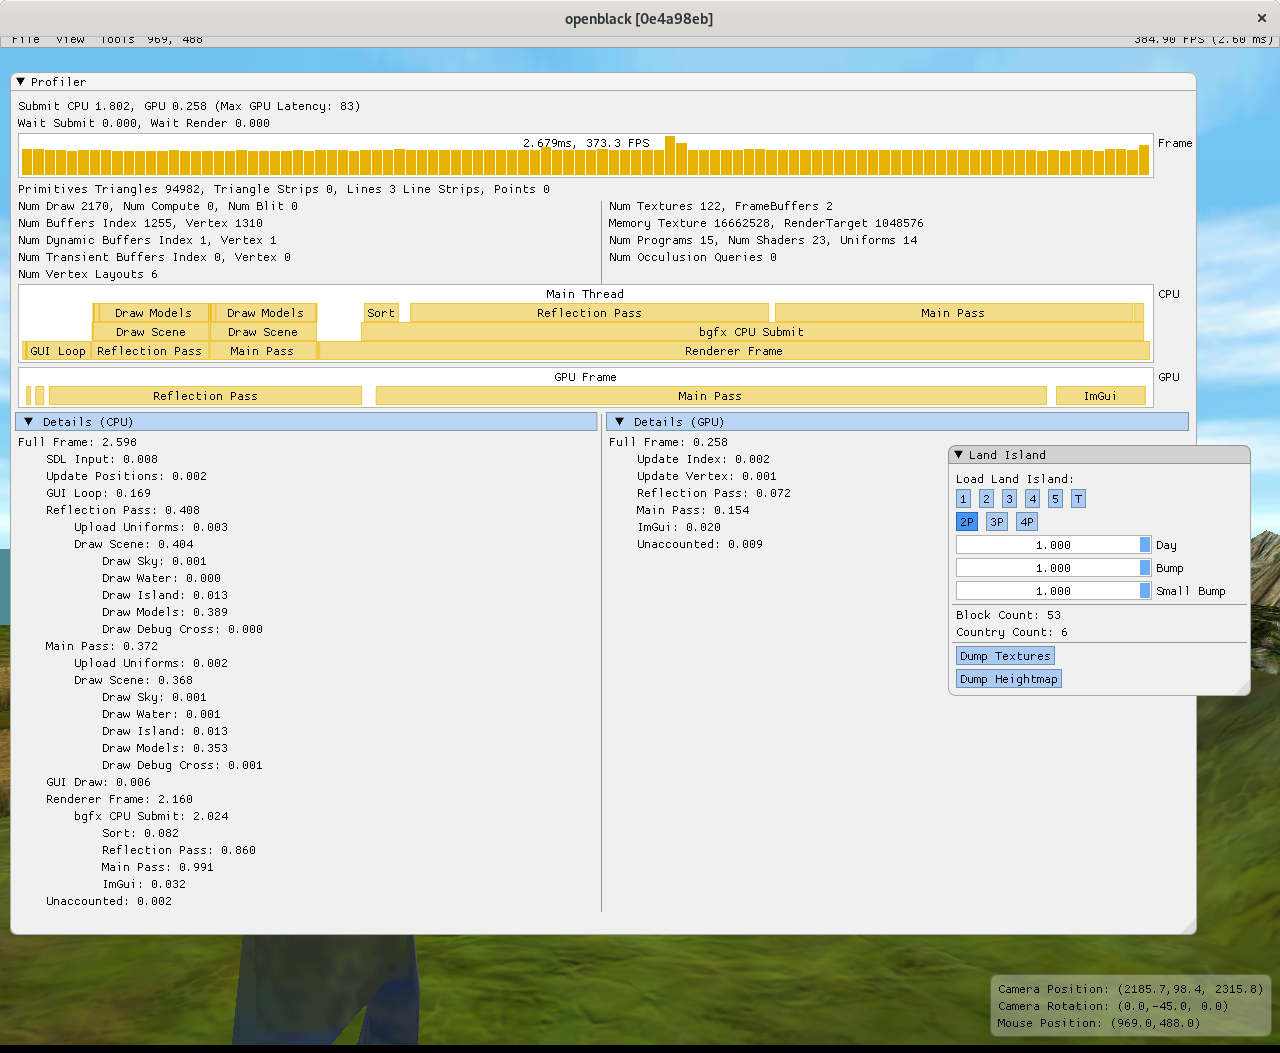
The results show that most of the time is not spent in sorting but instead in the actual dispatch in each view. The fact that encoding takes so long on the CPU is regrettable and shows that mesh, texture and shader complexity has room to grow.
Another interesting thing to note is that in the best case (Level 2P) and in the worst case (Level 5), the proportion of time spent encoding the bgfx calls, the time spend by bgfx for dispatching the GPU calls and the time spent on the GPU executing those calls is about the same. The ImGui view does not change based on the scene and this is logical since the ui is the same. However, the sorting, the reflection pass and the main pass all seem to scale according to the number of draw calls issued which would make sense if the worst case has much more geometry to render.
A solution to this would be to reduce the amount of geometry assigned to bgfx to encode.
Before starting, though, it is important to know which part of the rendering is most costly.
OpenBlack has five main groups of geometry rendering:
- Sky
- Water
- Island Terrain
- Entities
- Debug Cursor
Optimization can be done on the terrain and on entities. The Sky, being only one primitive with its own specific state and geometry can be seen as a constant overhead as it will never scale, the water and debug cursors are the same. The terrain is made of static blocks which could be drawn as instances. The entities are the most wildly varying geometries. They are dynamic and their numbers can vary even throughout a game play (e.g. trees grow and spread creating new trees to render).
Adding boolean checkboxes to enable or disable any of these groups allows for quickly verifying which of these groups would benefit the most from optimization.
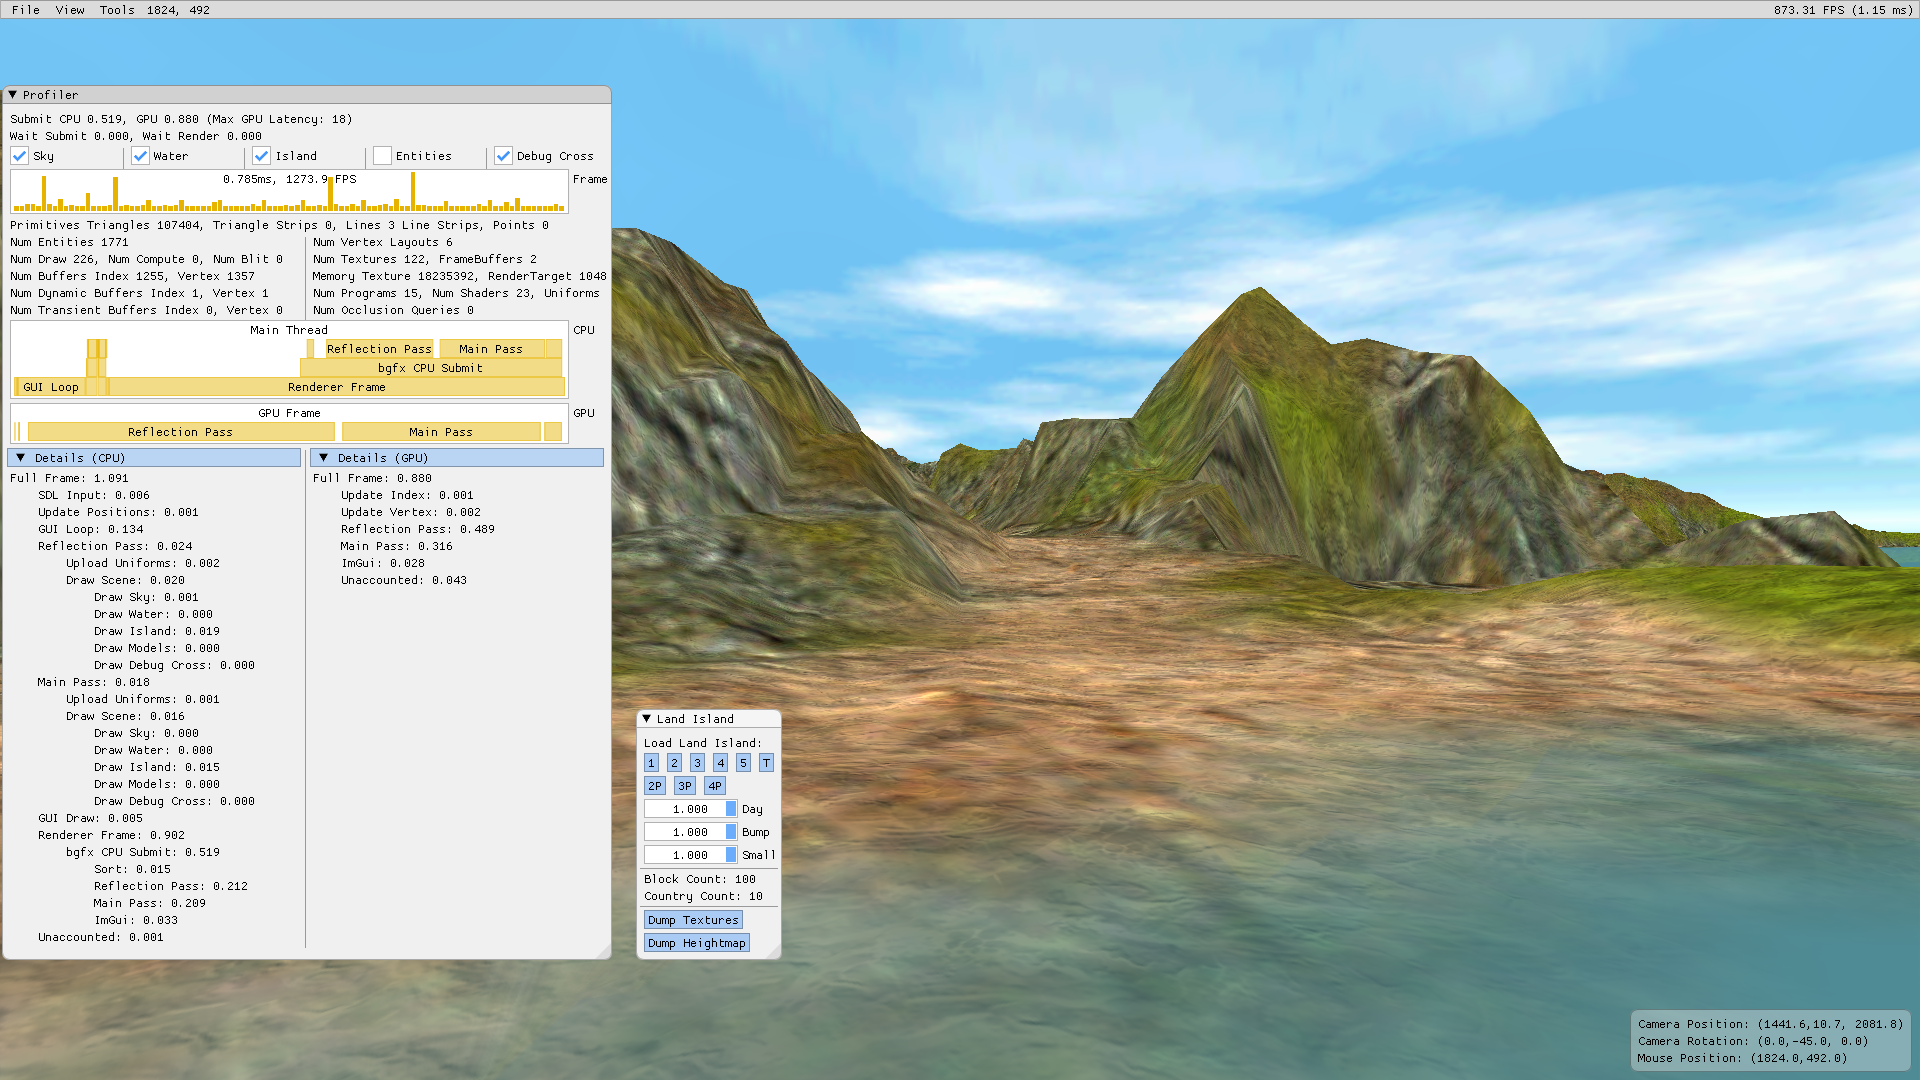
Skipping Entities lowers the rendering time to around 1ms on both the CPU and GPU. At the speed, there is much more relative jitter in the timings but it shows a lower limit for the rendering time.
While culling these entities to the frustum could speed up rendering for certain angles of the camera, it wouldn't provide enough of a general speed-up to the recorded performance bottle necks of the encoding. Nevertheless, since I was already exploring this, I added the functionality of bounding boxes to the engine for future use such as culling but also picking and intersections [6].
Skipping any of the other entries do not affect the rendering time as much. The most significant speedup, unsurprisingly, comes from removing terrain rendering for a speed-up of about 1ms.
High level optimization: Batching draw commands into Instance draws and sparsely updating transform matrices.
Since most of the time spent in the rendering is due to encoding and dispatching draw call of entities, the number of encoding and dispatching should be optimized.
By far the most expensive draws are those of the trees since there are hundreds of individual draw calls for identical meshes of trees.
The entities are stored in an entity component system which loops through all types of entities one at a time in a data-oriented way using entt [7].
The data-oriented design is however, impeded by the fact that for each instance of an entity, we encode a matrix uniform upload and then encode a draw command. Worse still, the matrix uniform upload was done for each pass. openblack does two rendering passes: one for the water reflection and one for the actual scene. This means that matrices are uploaded twice with the same data.
The solution to this was to firstly decouple matrix update from draw call dispatch. A new function called PrepareDraw was added to be called only once during uniform updates. This already reduces the time spent in half. This function has one traversals of every entity and one traversal of every mesh. Since there is a lesser or equal number of meshes than of entities and they are done sequentially, this does not increase the algorithmic complexity. The first traversal counts the number of instances of every entity's meshes there are and stores the result. If the amount of instances is larger than the size of the dynamic GPU buffer reserved for these instances' uniforms, then it is resized. The second traversal traverses the entities again in batches of meshes and stores their uniforms in a semi-sorted way based on the counting from the previous pass. This way all matrices of one mesh type are sequential and followed by all matrices of another mesh type until the last mesh type. These uniforms are then uploaded to a dynamic GPU buffer in one copy command.
This reduces the overhead of command dispatching and hardware transfers from #entities to 1 while the traversal stays the same save for the smaller amount of operations and being done once instead of once per pass. The operations are essentially incrementing integers (counting) while traversing data in a linear way in the first pass and writing uniform data to a buffer in a linear way in the second pass.
Additionally, this update is done only when the scene updates. Since this scene is static most of the time, this function call has zero cost.
Finally, the original DrawModel call is simplified to traversing the result from the first part of PrepareDraw and submitting instanced draw calls of every type of entity with the offset of their uniforms in the dynamic buffer.
This reduces the traversal complexity from O(#entities) to O(#mesh types) which in practice goes from a few thousands to less than a hundred. This being the only function called in a static scene and receiving the best complexity improvement means the speed-up is significant. It also means that in a scene where the number of trees, for example, increases and decreases, the cost of this function remains constant as the complexity is linked to the type tree and not the number of trees. The cost savings are saved in both this traversal and in the call dispatch. The GPU drawing of these will still scale based on the number of instances but the cost is very low.
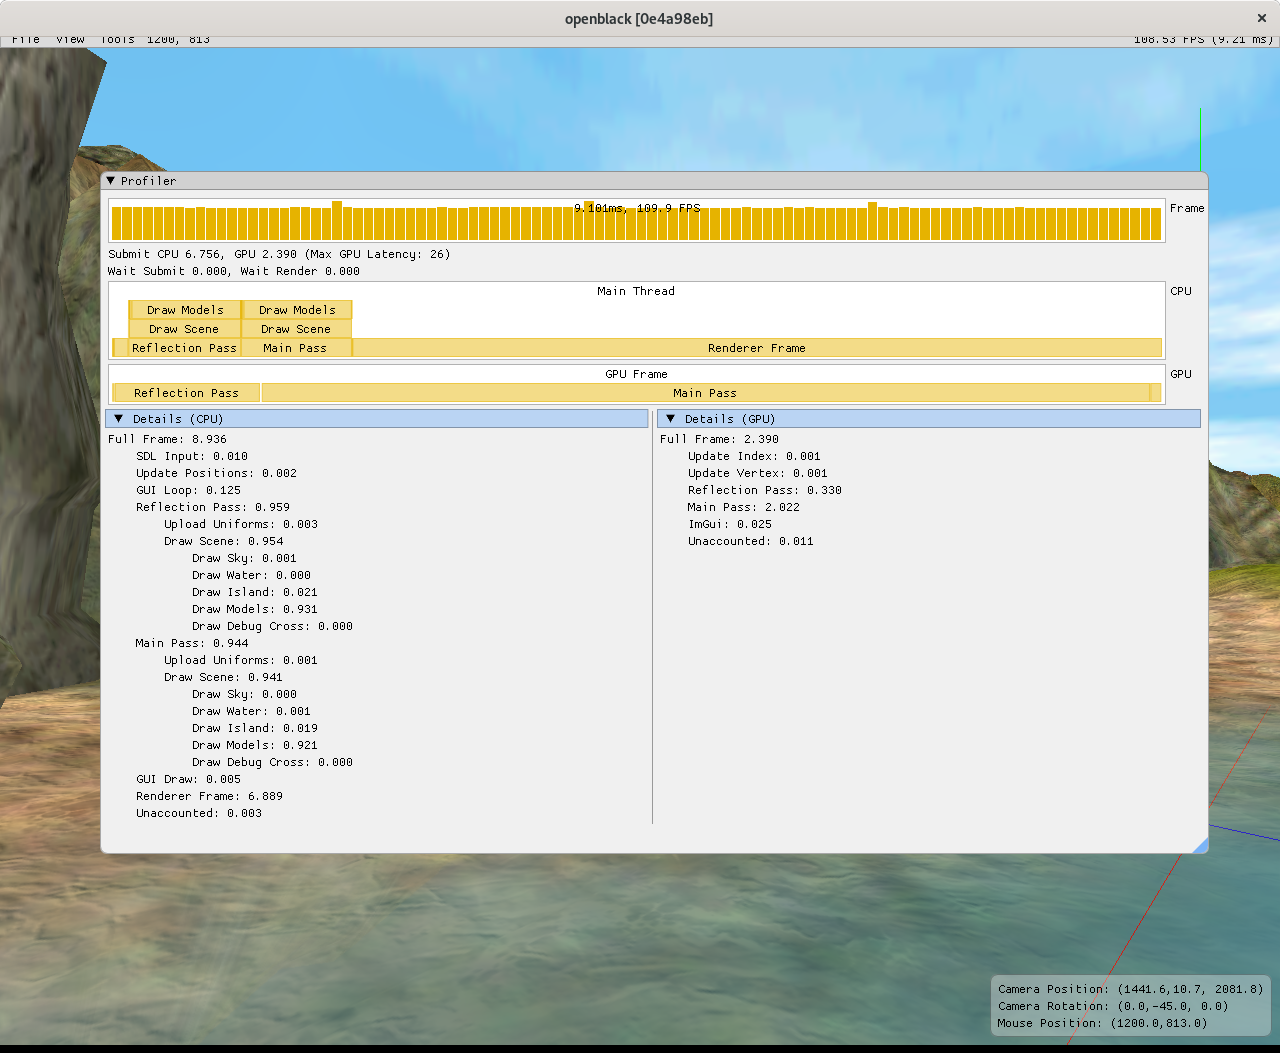
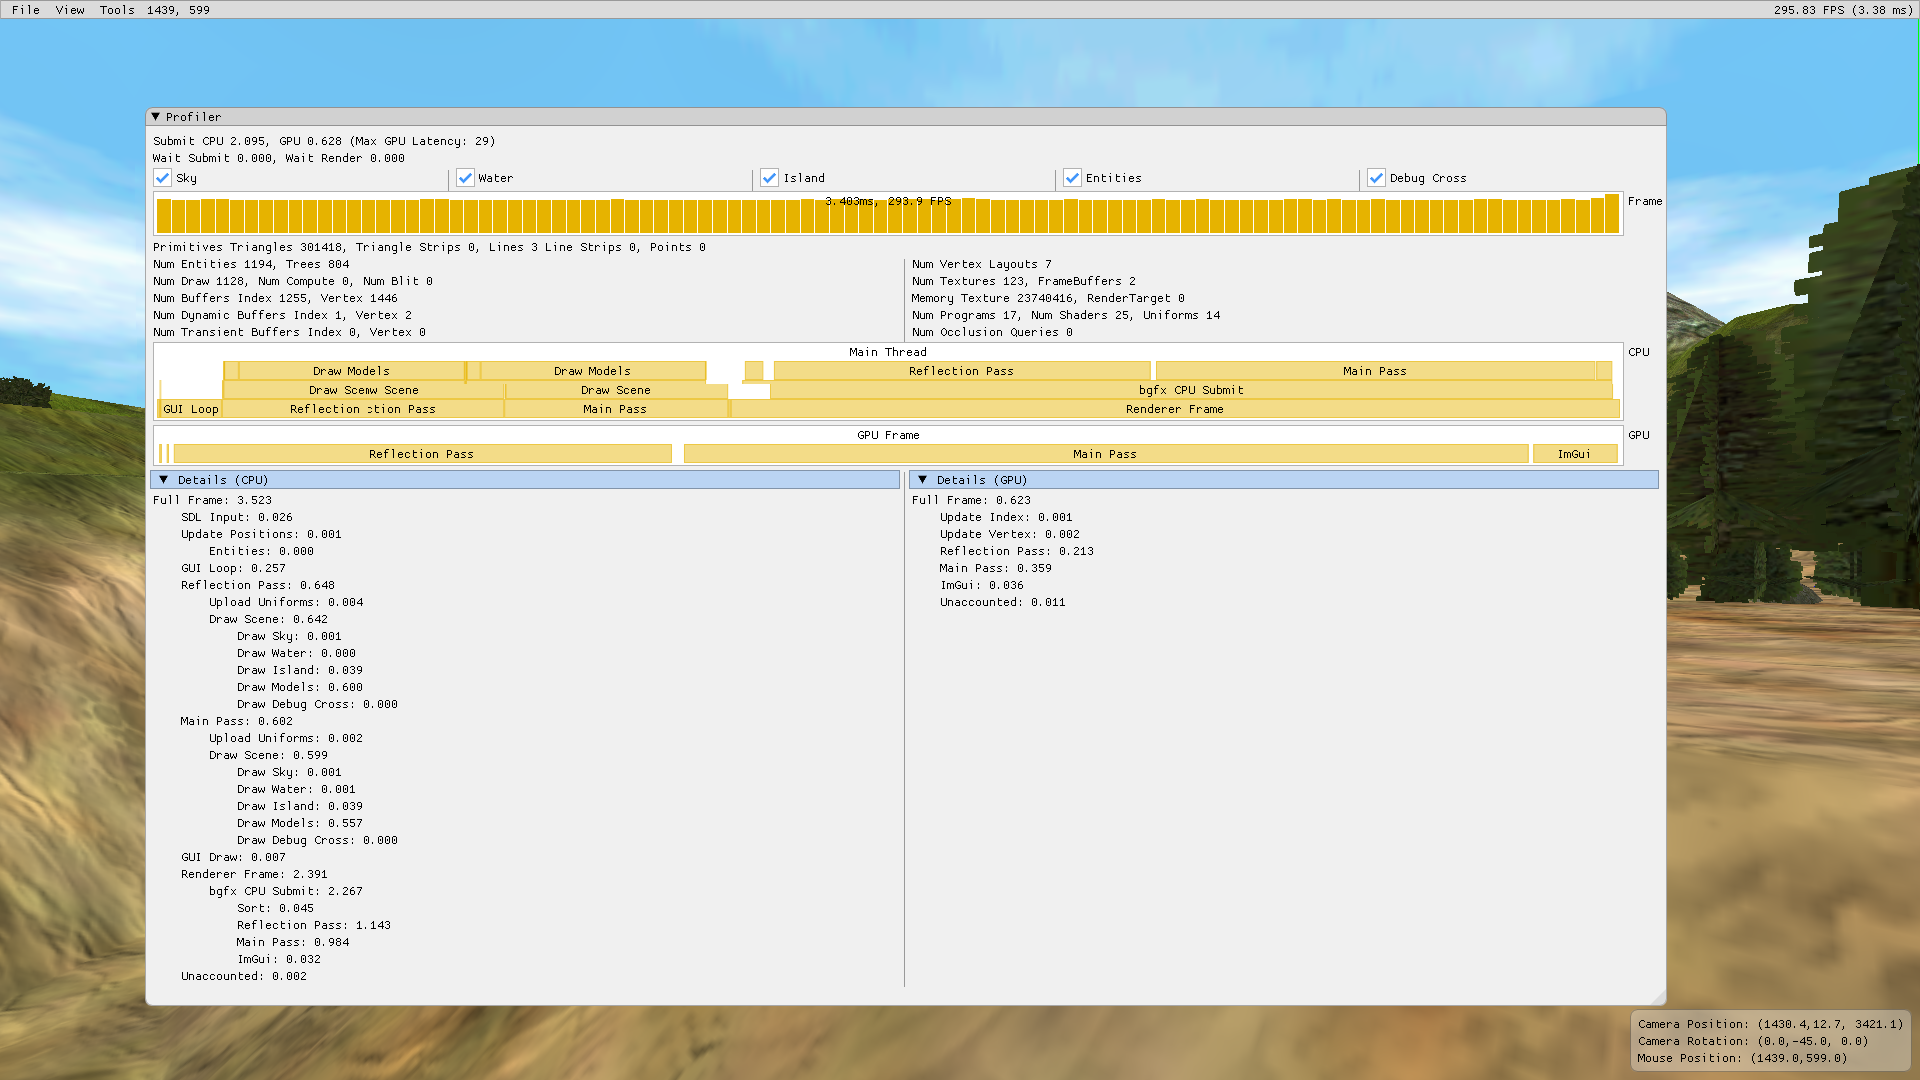
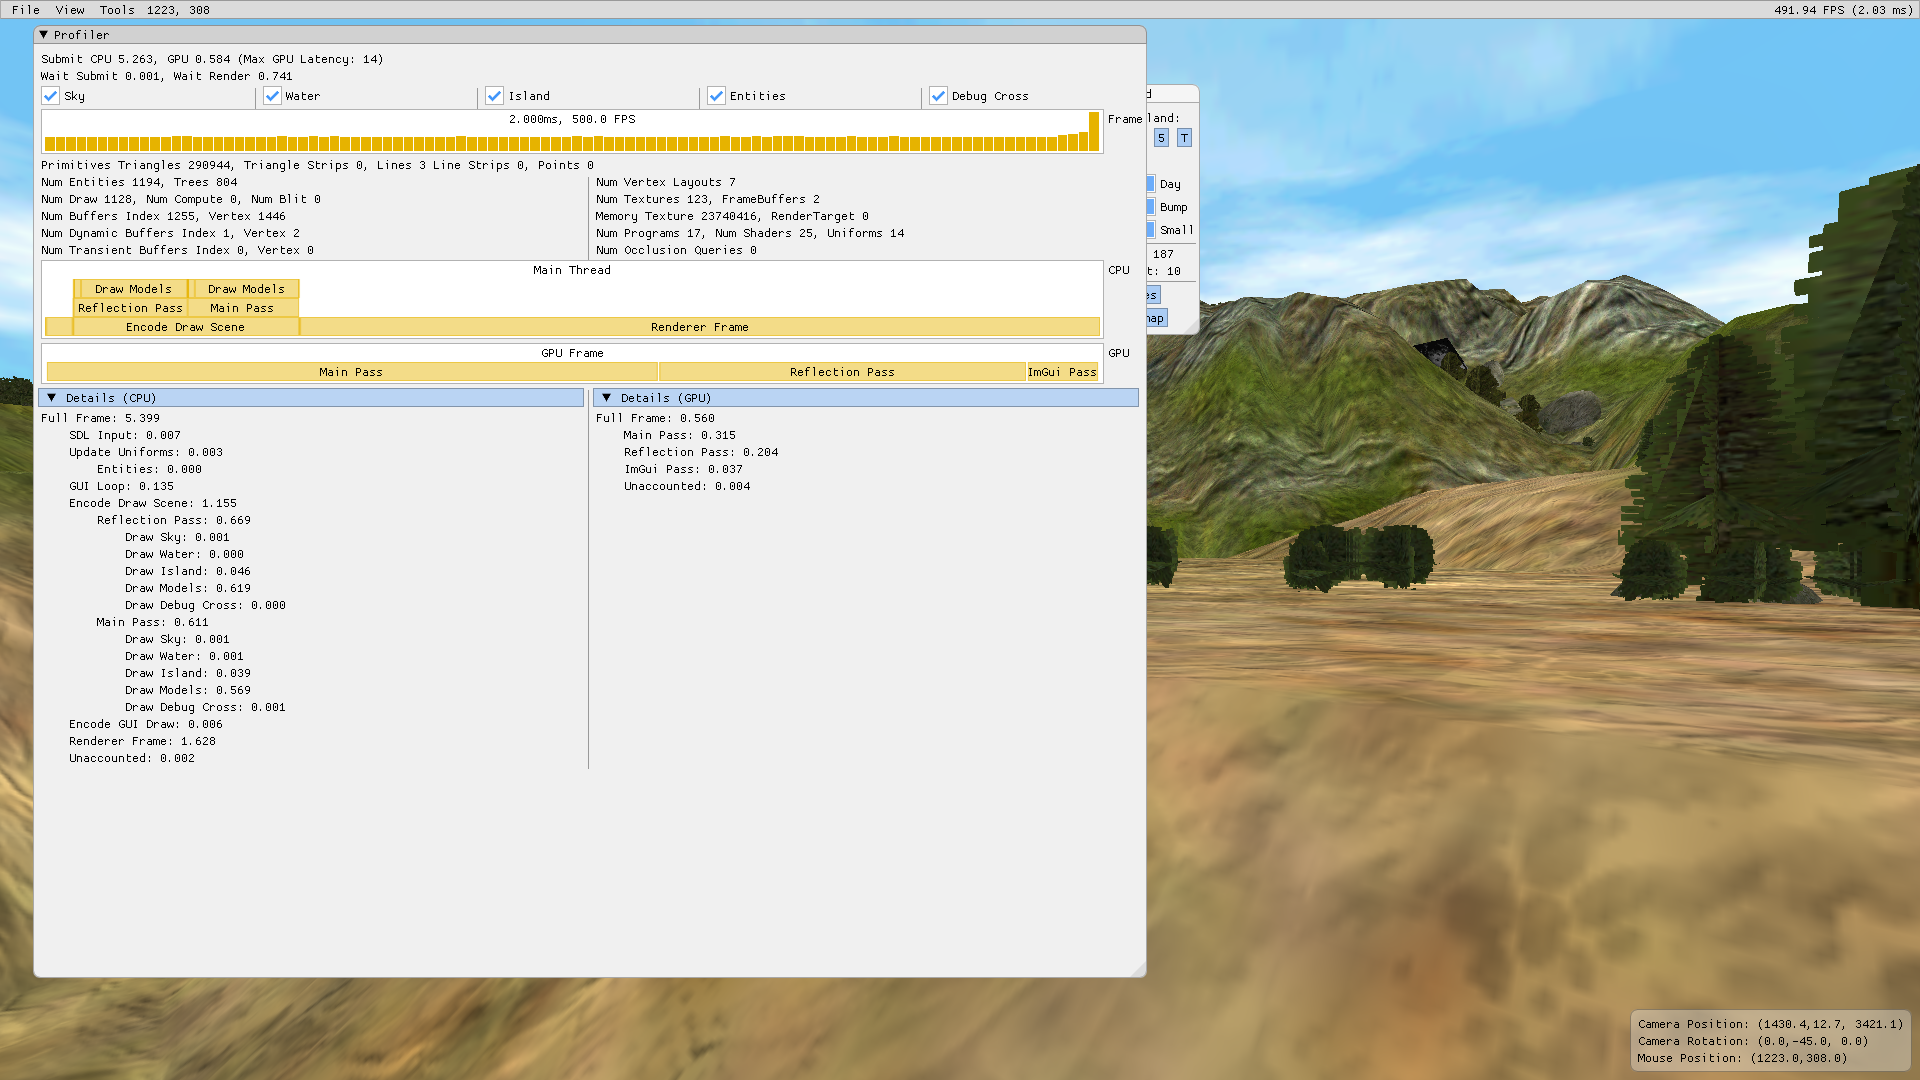
Indeed this is what we see. The frame time has been reduced to 3.0ms. Command encoding takes 0.6 ms per pass and the library's dispatch is now down to 1.0 ms per pass. The rendering is around 300 Hz and it is actually updating faster than the time a screenshot takes to save the image.
With that done, I contacted the maintainer and created a pull request [8] with my changes.
The rendering library bgfx has a concept of encoders which are thread-safe ways to encode drawing commands. This allows the use of multiple threads to encode multiple draw commands. This does not reduce the overhead in the RenderFrame section which unfortunately dominates the frame.
That section in question does not provide a lot of areas to optimize. The time spent is mostly in the proprietary opengl driver and the rest is already low-level optimized.
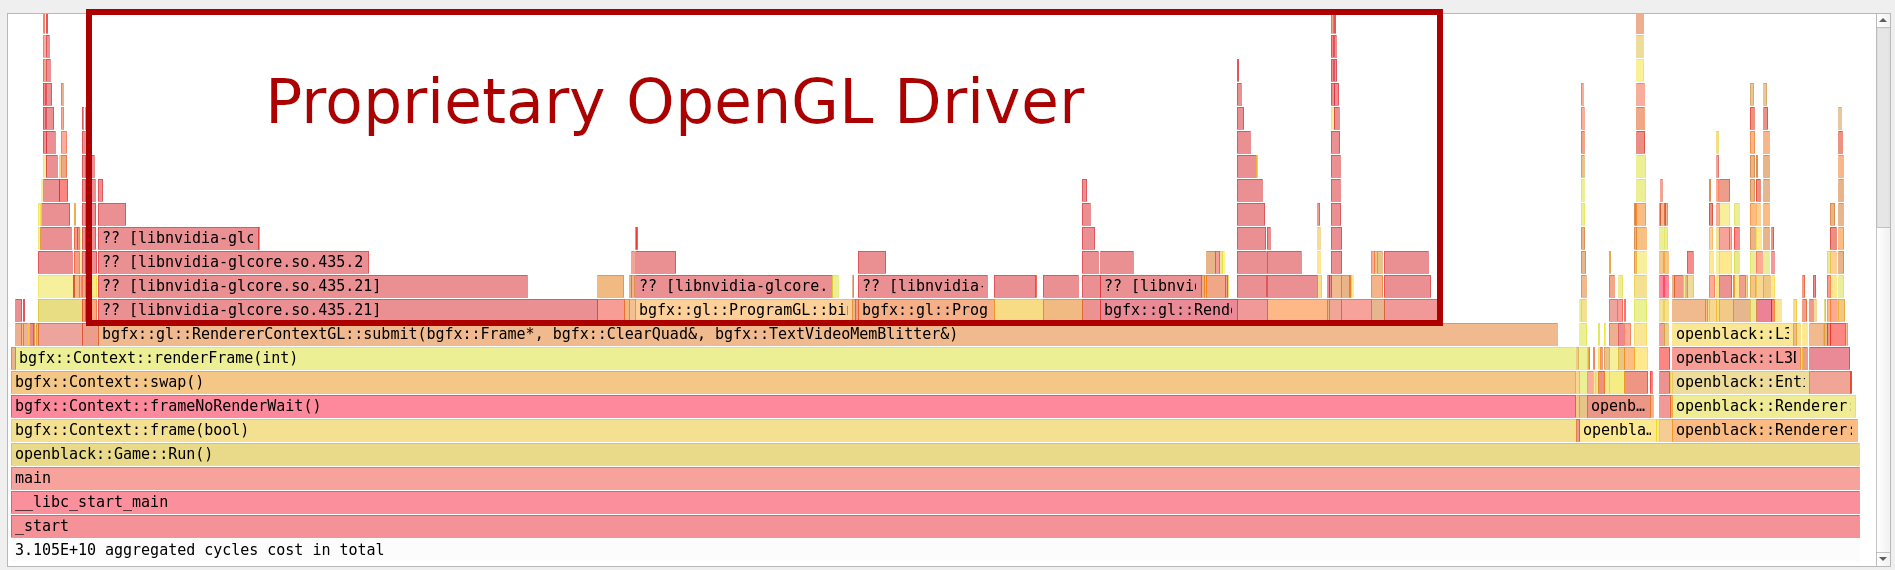
However, thanks to bgfx's multithreaded encoders, the dispatch section can be moved to its own thread and be made to wait on the encoding.
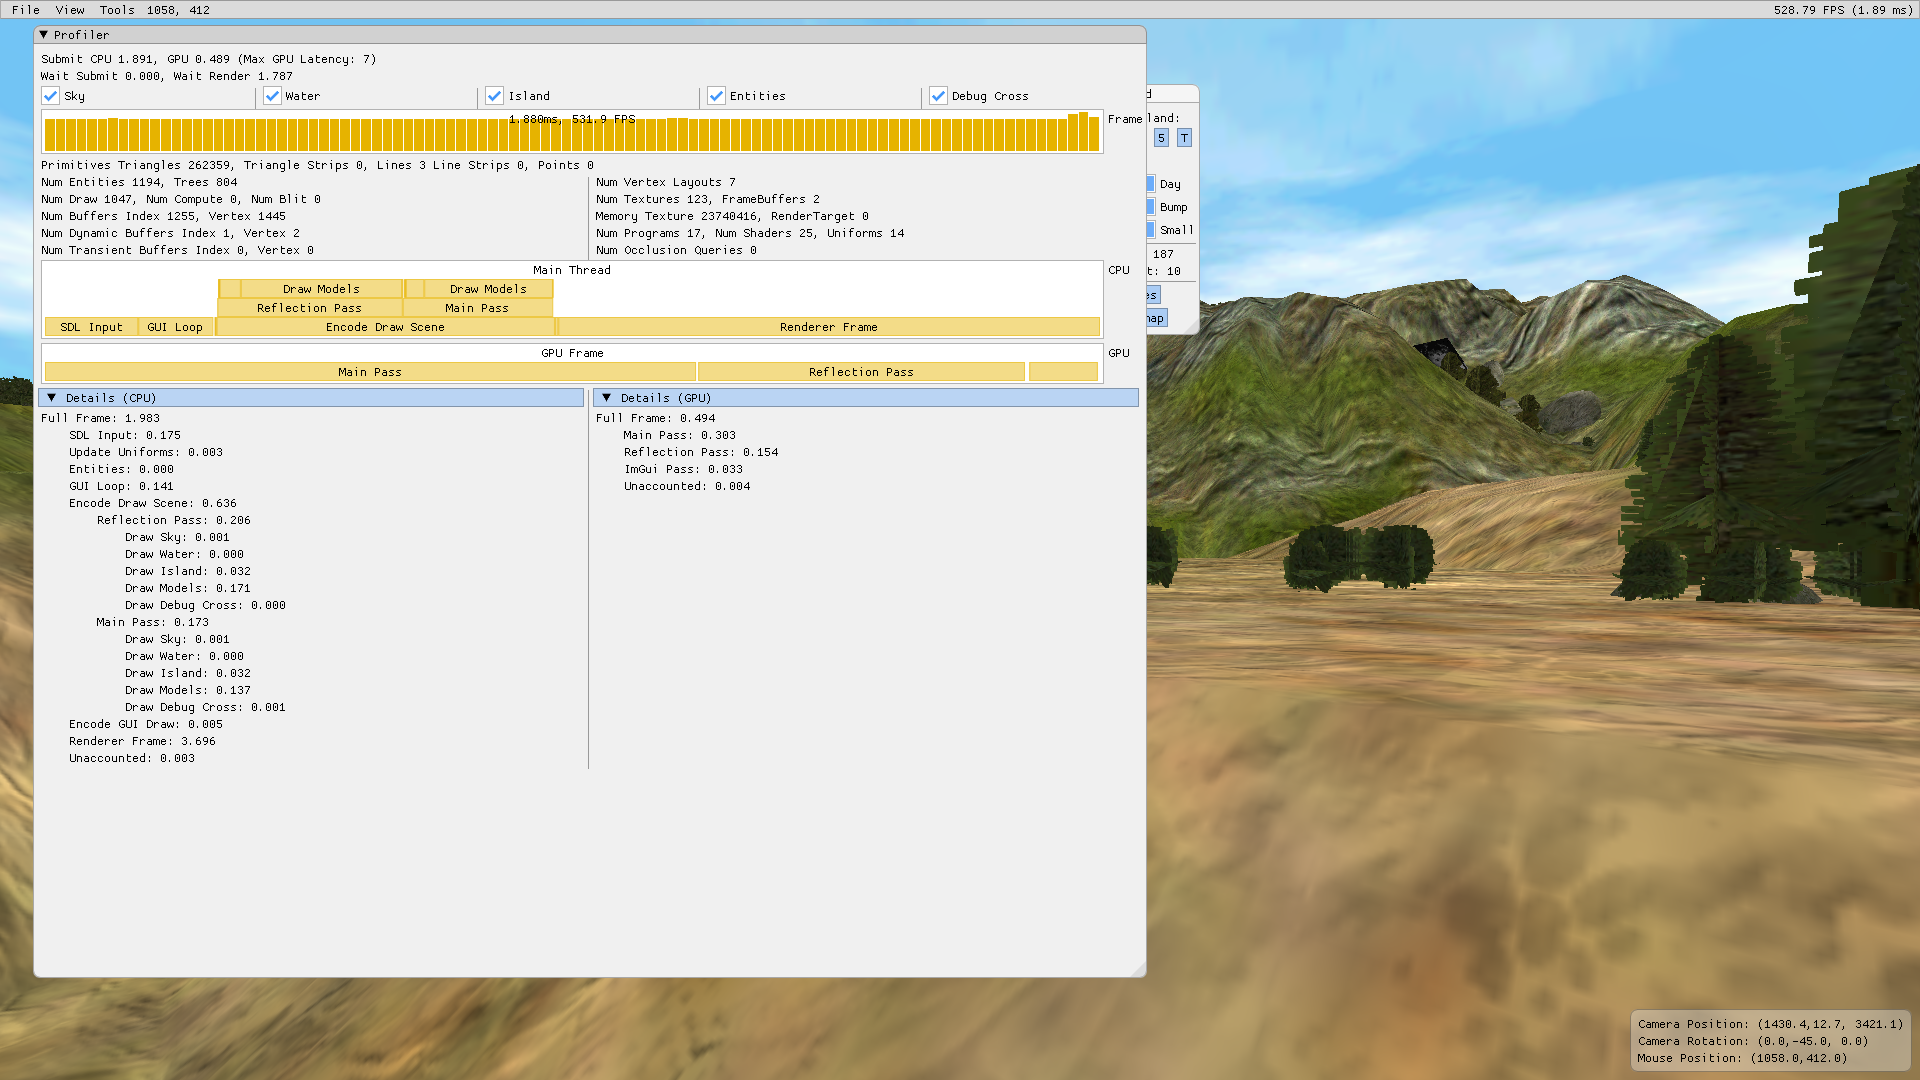
With the dispatch to OpenGL on another thread, the frame time become less than 2 ms. The ratio of time spent by the encoders on the encoding thread becomes significant again.
These changes were presented to the upstream project to be incorporated [9].
In the encoding section, the models still dominate the drawing. This is because a draw command is encoded for each of the 600 models. In order to optimize this encoding, a specialized thread pool was created to divide the work but keep the threads alive and waiting on a conditional variable. This allows the work to be be divided between threads. An encoder per frame and per thread is spawned and re-used between passes. After the passes are done, the main thread waits on an execution fence in the thread pool before submitting the encoders.
The speed-up was a modest quarter millisecond.
The changes push the project to new speed record but the complexity of a thread pool is too much for the project to stay maintainable in the future. The speed-up is also far from the theoretical maximum when using 8 threads.
By far the most beneficial optimization was done in the first iteration. It did a lot of things at the same time and demonstrate how the design of a GPU tends to allow pre-calculation and data-driven development to thrive. Moving uniforms into a large buffer for instancing not only prevents expensive calculations, but puts data in a linear access pattern with proper memory alignment for the GPU cache lines. Instancing is a very basic form of GPGPU offloading the cost of encoding and dispatching individual calls to the GPU.
Multi-threaded encoding would have had much more of an impact if instancing wasn't a solution. It does help but since more than 3/4 of a frame is in the OpenGL driver due to state changes and dispatch commands going through the OpenGL state machine.
The small speed-up in encoding of an already lightning fast render loop was not worth the overhead of maintaining it. This could possibly change if the scene is not static.
Some low-level command optimizations were done in the previous steps but optimizing other sections of code were not possible in the case of bgfx which already has cache-line aligned data structures and is heavily optimized and other cases were not significant enough to do anything about. Some functions had too many arguments which overran the amount of available registers and they were reduced.
To address the OpenGL driver problem in the future, which is a well known problem, the project should switch to a lower-level rendering API such as Vulkan and Direct3D12. This was out of the scope of the assignment because the current implementation of Vulkan and Direct3D12 have major bugs and do not render anything.
The original optimization goal was to be able to run level 5 at full screen with my 144Hz screen. The second goal was to reach performance of the fastest level (2P) with the slowest level (5). The original time of a frame for the fastest level was 2.6 ms and 10 ms for the slowest. With all the optimizations listed, openblack runs the slowest level at 1.8 ms and even faster without the profiler.
All in all this was a huge success. Not only is the code now much faster, it scales better with the number of entities. And on top of that, this optimization came with many improvements to architecture, functionality and bug fixes. In total, 18 pull requests [10] were sent to the openblack project with most of them merged. Additionally, some pull requests were sent to bgfx [11].
- [1] https://github.com/ocornut/imgui
- [2] http://www.brendangregg.com/flamegraphs.html
- [3] https://github.com/bwrsandman/imgui-flame-graph
- [4] https://github.com/bkaradzic/bgfx
- [5] https://github.com/openblack/openblack/pull/140
- [6] https://github.com/openblack/openblack/pull/141
- [7] https://github.com/skypjack/entt
- [8] https://github.com/openblack/openblack/pull/142
- [9] https://github.com/openblack/openblack/pull/146
- [10] https://github.com/openblack/openblack/pulls?utf8=%E2%9C%93&q=is%3Apr+author%3Abwrsandman+
- [11] https://github.com/bkaradzic/bgfx/pulls/bwrsandman