You signed in with another tab or window. Reload to refresh your session.You signed out in another tab or window. Reload to refresh your session.You switched accounts on another tab or window. Reload to refresh your session.Dismiss alert
{{ message }}
This repository has been archived by the owner on Sep 17, 2021. It is now read-only.
Hey Nice Package Btw man! There's not a lot of good packages out there in react-native in supporting charts for now. So this was kind of very helpful for me.
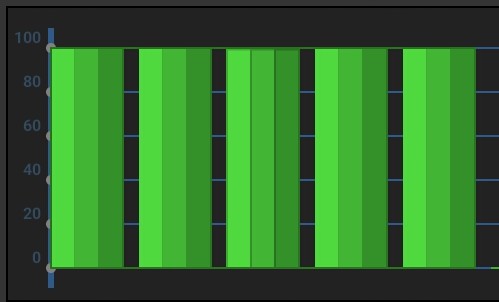
So The way I Understand it Bar Charts Supports 3 Colors (1 color that is just being darkened for a pattern of 3) so if I have a data of :
[{
"value": 100,
"name": "apple",
}, {
"value": 100,
"name": "apple",
}, ],
[{
"value": 100,
"name": "banana",
}, {
"value": 100,
"name": "banana",
},],
[{
"value": 100,
"name": "grape",
}, {
"value": 100,
"name": "grape",
}, ]
So I will have a graph that looks like this: Image1:
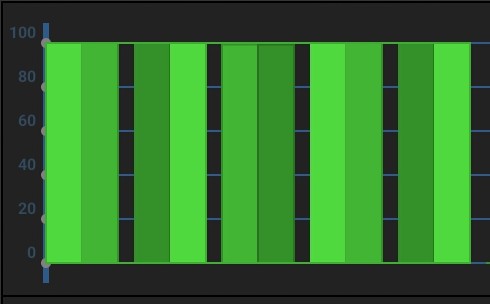
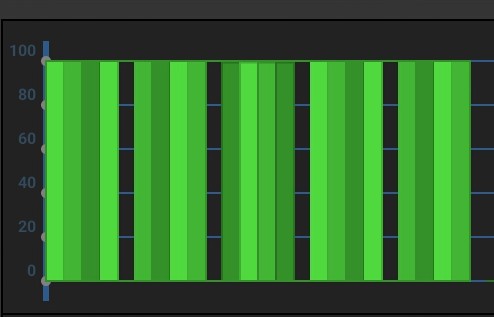
My Problem is that when I have a data which has a group of 2 or more than 3 (shown in image 2&3) The Pattern of 3 colors still remains.
Image2
Image3
Is There a way that I could color the bars by group. Like 2 colors per group of 2 bars and 4 colors per group of 4 bars?? Anyway man Really loved your work. I'm so grateful for this one. Hope to hear from you soon. Thank You =)
The text was updated successfully, but these errors were encountered:
Yes - certainly a bug. Thanks for the compliments and sorry for the delay in responding. Interesting that no one has caught this before. So, thanks for submitting it. I just addressed this in a new pull request and we will get that merged in soon.
@marzolfb Thank You for the fix. Really appreciate it, was wondering if you could publish the changes to the npm. Anyways thanks man =) so happy for this.
Hey Nice Package Btw man! There's not a lot of good packages out there in react-native in supporting charts for now. So this was kind of very helpful for me.
So The way I Understand it Bar Charts Supports 3 Colors (1 color that is just being darkened for a pattern of 3) so if I have a data of :
[{
"value": 100,
"name": "apple",
}, {
"value": 100,
"name": "apple",
}, ],
[{
"value": 100,
"name": "banana",
}, {
"value": 100,
"name": "banana",
},],
[{
"value": 100,
"name": "grape",
}, {
"value": 100,
"name": "grape",
}, ]
So I will have a graph that looks like this:

Image1:
My Problem is that when I have a data which has a group of 2 or more than 3 (shown in image 2&3) The Pattern of 3 colors still remains.
Image2

Image3

Is There a way that I could color the bars by group. Like 2 colors per group of 2 bars and 4 colors per group of 4 bars?? Anyway man Really loved your work. I'm so grateful for this one. Hope to hear from you soon. Thank You =)
The text was updated successfully, but these errors were encountered: