- Visuzalization with Google Data Studio
- Works with InterSystems IRIS Analytics (DeepSee)
- Utilizes
/api/deepseeembeded in IRIS - Generates MDX queries and execute them on the target server
- Access to Google Apps Script
- cli tool for Google Apps Script, installed globally with npm
npm i @google/clasp -g
Authorize clasp to get access to your account on Google Apps Script, with command
clasp loginTo confirm successful authorization, may you this command
clasp login --statusClone this repo
git clone https://github.com/caretdev/iris-analytics-datastudio.git
cd iris-analytics-datastudio
Deploy the application with one make command, this will create a new project on Google Apps Script, push files there, and deploy it
makeAny subsequent make will skip creation Google Apps Script if file .clasp.json exists. And will skip to create a new deployment if file .deploymentId exists. For existing deployment it will create a new version with the deployment id stored in file .deploymentId. So, after any changes in javascript files, needs to call make to deploy those changes.
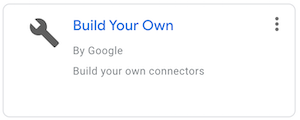
Open Google Data Studio. Create a new Data Source, select "Build your own" connector.
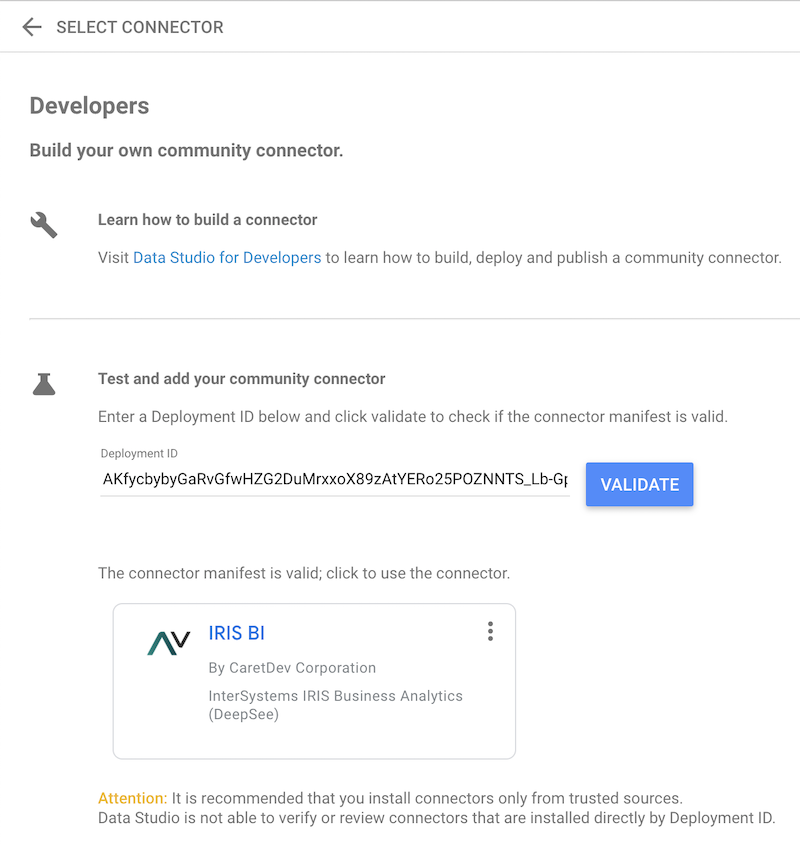
Enter Deployment ID stored in file .deploymentId, and press Validate, it should show the tile with a new connector below
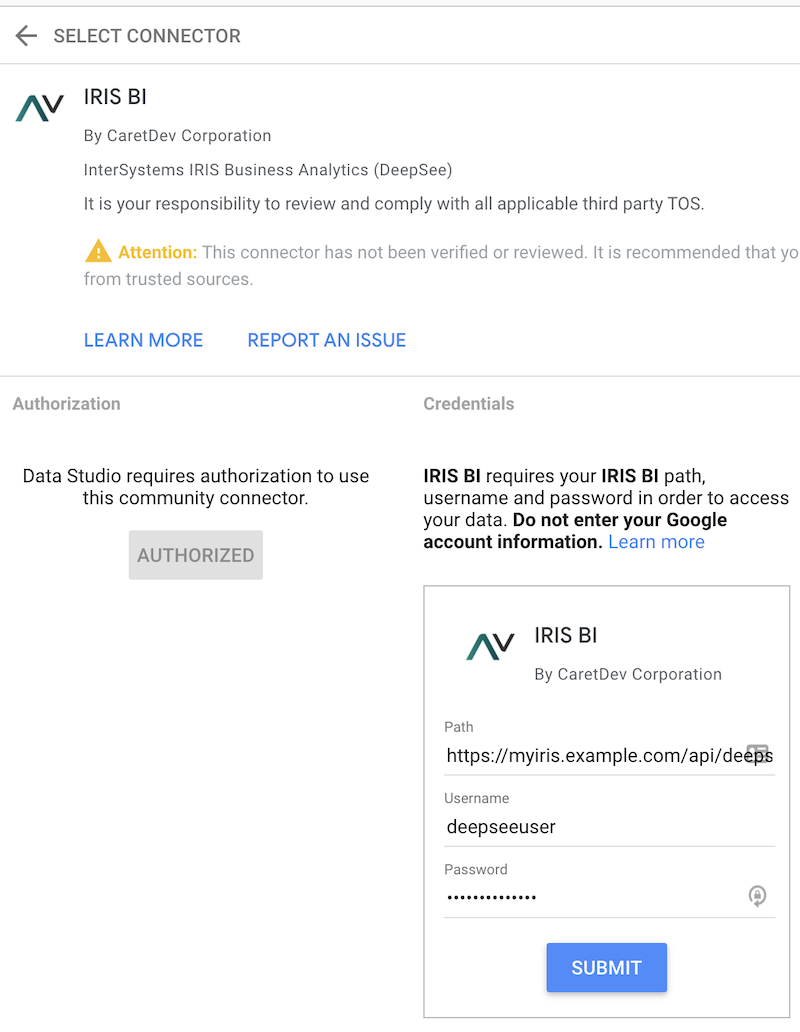
Authorize connector, by button Authorize. Then it will be possible to enter URL to /api/deepsee of desired server available online, and credentials. URL should be in form https://myiris.example.com/api/deepsee/v1/MYNAMESPACE/, with /api/deepsee and target Namespace. Username and password for user with permissions to execute queryes there
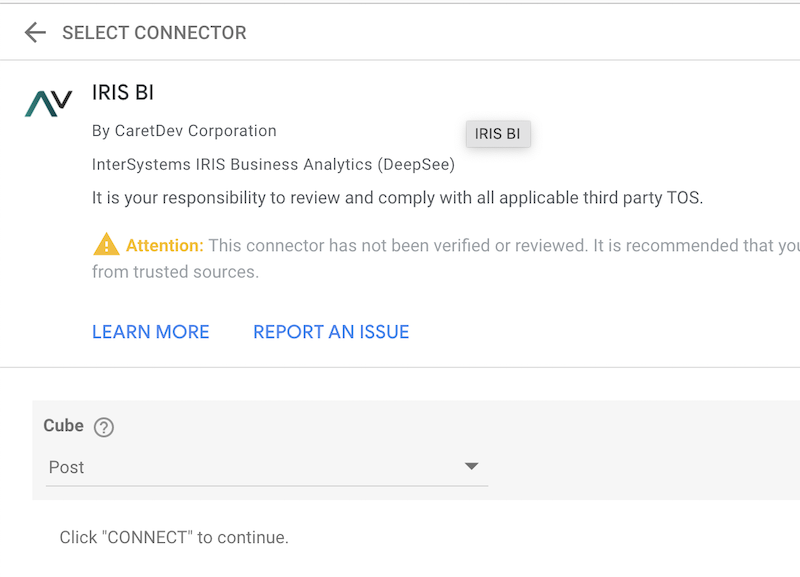
After veerification, it will allow to select a Cube, then press Connect
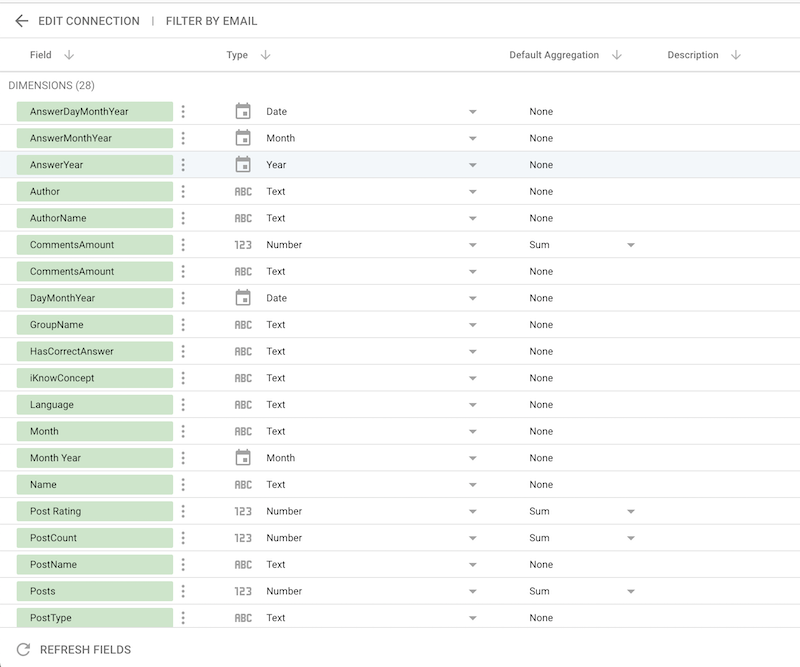
On the next screen it should show all the dimensions and metrics available for the selected cube
