Table of Contents
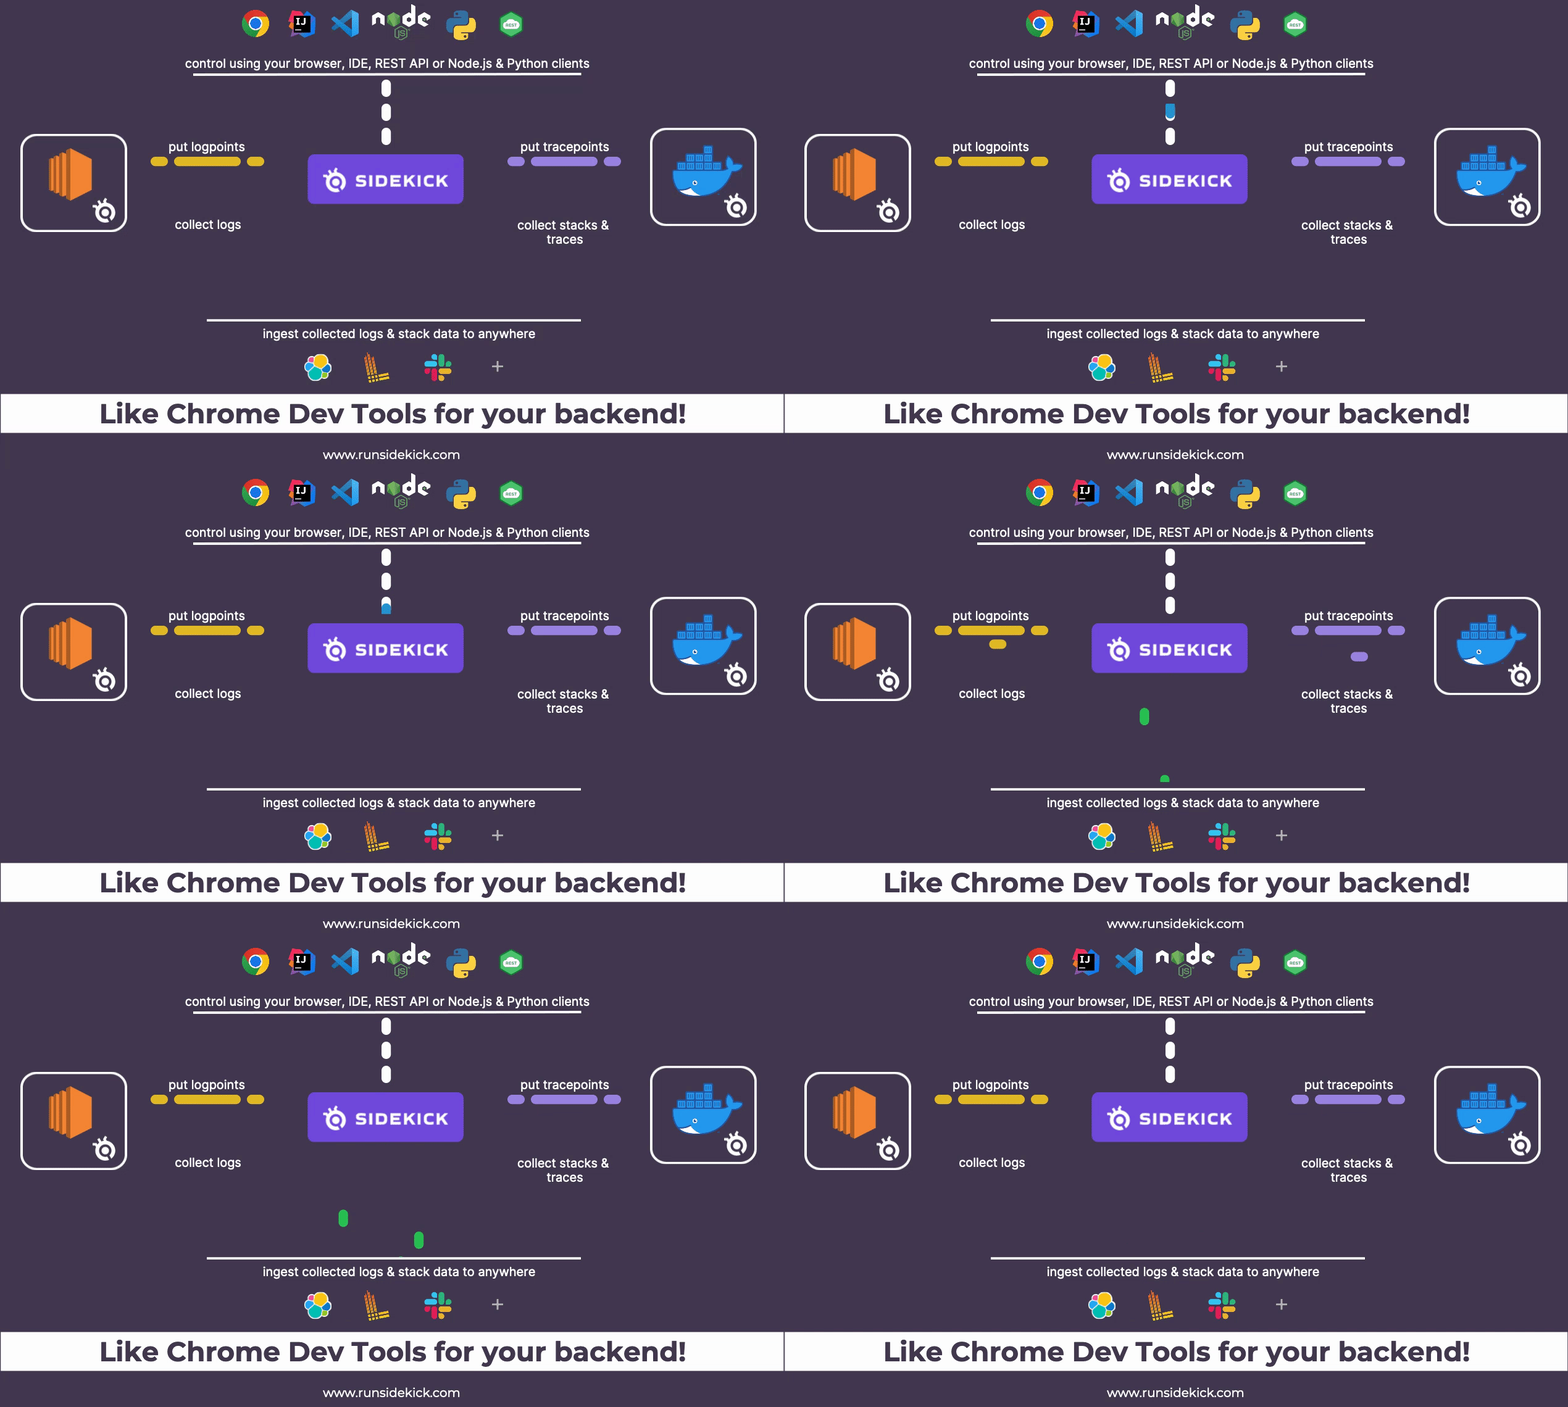
Sidekick is a live application debugger that lets you troubleshoot your applications while they keep on running.
Add dynamic logs and put non-breaking breakpoints in your running application without the need of stopping & redeploying.
Sidekick Open Source is here to allow self-hosting and make live debugging more accessible. Built for everyone who needs extra information from their running applications.
Sidekick has two major actions; Tracepoints & Logpoints.
- A tracepoint is a non-breaking remote breakpoint. In short, it takes a snapshot of the variables when the code hits that line.
- Logpoints open the way for dynamic(on-demand) logging to Sidekick users. Replacing traditional logging with dynamic logging has the potential to lower stage sizes, costs, and time for log searching while adding the ability to add new logpoints without editing the source code, redeploying, or restarting the application.
Supported runtimes: Java, Python, Node.js
To learn more about Sidekick features and capabilities, see our web page.
You can use Sidekick in any stage of your development for your live debugging & logging needs. With Sidekick you can:
- Debug your remote application (monoliths or microservices on Kubernetes, Docker, VMs, or Local) and collect actionable data from your remote application.
- Add logs to your production apps without redeploying or restarting
- Cut your monitoring costs with on-demand & conditional logpoints & tracepoints
- On-board new developers by showing how your apps work using real-time data.
- Observe Event-Driven Systems with ease
- Programmatically control where and when you collect data from your applications
- Either use Sidekick's Web IDE, VS Code & IntelliJ IDEA extensions to control your Sidekick Actions or use headless clients to bring Sidekick to your workflow in any way you want!
- Evaluate the impact of an error on applications with integrated distributed tracing.
- Collaborate with your colleagues by sharing snapshots taken by Sidekick.
- Reduce the time spent context-switching between different tools.
All these with almost no overhead. PS: Check out our benchmark blogs
- Conditions & custom hit limits for your logpoints and tracepoints -> collect only what you need
- Mustache powered expression system for logpoints -> easily add variable data to your logs context
- Customizable agents -> configure how your agents work, define depth and frame numbers
- Aggregate your collected data with Thundra APM and Open-telemetry traces
- Collect errors automatically and send them to your target of choice (will be available at 30th Aug)
- Define custom data redaction functions to control what is being collected (Node.js only)
- Control your logpoints and tracepoints using programmatically
- Work with your collected data in your way using Sidekick clients
While utilizing log data seems the most obvious choice for debugging a remote application, Sidekick provides an extra edge with a seamless debugging experience that is similar to debugging an application on your local environment.
Whether you're a developer, testing software engineer, or QA engineer, Sidekick is here to help you find the root cause of the errors.
Sidekick consists of 3 layers; The broker is the central unit of Sidekick. It controls all the data flow between clients and agents. This very repository contains the Sidekick broker.
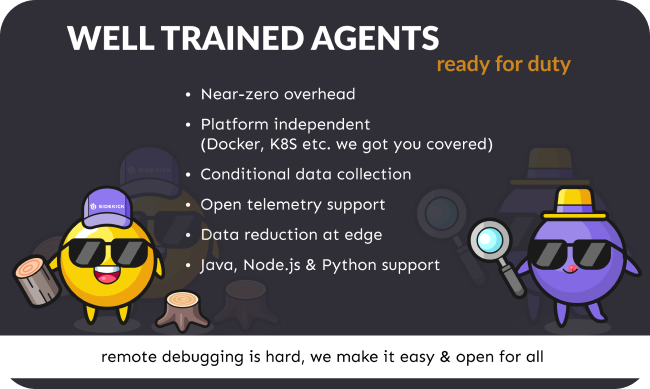
Agents are the layer where Sidekick actions meet with your applications. Agents deployed with your software lets you collect snapshot data and generate dynamic logs without modifying your code. Agents get orders from clients and start listening to the targeted lines with given properties. Then whenever your code hits a logpoint or a tracepoint, agents collect stack & log data and send them to the clients via the broker. Currently, we have agents for Java, Python & Node.js runtimes.
Clients let you interact with the agents. They send commands to agents via the broker and let you control your tracepoints & logpoints. Clients come in many different ways:
- The first one is Sidekick Web IDE, which you can use with our SaaS & on-prem versions, it lets you collaborate with other developers, and control your agents, workspaces & users from your browser. Since it is a web app, it does not require any installation. To learn more about Sidekick SaaS & On-prem features and capabilities, see our web page.
- Secondly, we have our IDE extensions. They enable you to control your agents with the comfort of your IDE. Currently, we have extensions for Visual Studio Code & IntelliJ IDEA. Check out the Clients section below.
- Last but not least, you can also use Sidekick with a headless approach. Sidekick Rest API lets you apply CRUD operations over logpoints & tracepoints via HTTP protocol and other clients like Sidekick Node.js Client lets you control your agents programmatically and make use of your collected data using code.
The simplest way to use Sidekick is to create an account on Sidekick Cloud. For the self-hosted version, you can either build Sidekick yourself or use our Docker image.
Note
Make sure docker daemon is running.
-
- Go to the docker folder under the project
- Open
.envfile via any text editor- Set your secret token (you can set any value, this will be your master key)
API_TOKEN,BROKER_CLIENT_AUTHTOKENandBROKER_TOKENmust be the same, otherwise, you can’t connect your apps and your client
- Set MySQL secrets
- Set MySQL root password (
MYSQL_ROOT_PASSWORD) - Set MySQL user (
MYSQL_USER,SPRING_DATASOURCE_USERNAME) - Set MySQL password (
MYSQL_PASSWORD,SPRING_DATASOURCE_PASSWORD)
- Set MySQL root password (
- Set your secret token (you can set any value, this will be your master key)
-
-
Go to the docker folder under the project
-
Run command
docker-compose up -dand wait for a minute -
App is ready
-
You can connect to the broker using the url
ws://<your-server-hostname-or-ip>:7777 -
You can see the API's swagger interface at
http://<your-server-hostname-or-ip>:8084/swagger-ui.html
-
-
-
- Go to
sidekick/sidekick-broker-appfolder under project - Execute
release.sh
- Go to
-
- Go to
sidekick/sidekick-apifolder under project - Execute
release.sh
- Go to
-
Now that your broker is ready, you need to install your agents & clients to start using Sidekick. Check out them below.
To learn more see our docs.
Check out docs to learn how you can use agents with Sidekick Open Source!
Note: Agents are going open-source too! ETA: 30th of Aug
Check out docs to learn how you can use clients with Sidekick Open Source!
-
Sidekick Node Client opens up a new & headless way to use Sidekick. It allows you to both use custom ingest functions for the tracepoint or logpoint events and put/edit/delete your tracepoints/logpoints easily using code.
Note
This can be used with agents from all runtimes.
- Collect Realtime Stack Traces from NodeJS Applications
- How to add missing logpoints to your running applicatons without stopping and send them to Loki
Check out docs for more!
-
Ingest your Sidekick logs & snapshots to Loki. https://github.com/boroskoyo/sidekick-loki
Related blog post: Sidekick Recipes #2: Send logs to Loki -Add missing logs to your running microservices. Easy as 1–2–3
-
Send your collected tracepoint & logpoint events to Elasticsearch https://github.com/boroskoyo/sidekick-elastic
Related blog post: Sidekick Recipes #1: Elasticsearch Ingest
- Sidekick Open Source Live Debugger : Get started in 5 mins
- Past, Present, and Future of Sidekick
- Production Debuggers — 2022 Benchmark Results
Checkout CONTRIBUTING.md
To report a bug or request a feature, create a GitHub Issue. Please ensure someone else has not created an issue for the same topic.
Reach out on the Discord. A fellow community member or Sidekick engineer will be happy to help you out.


%201.png)

.gif)
.gif)

