EventDetails
back to Features
The "Event details" tab shows you details about the events as they were parsed
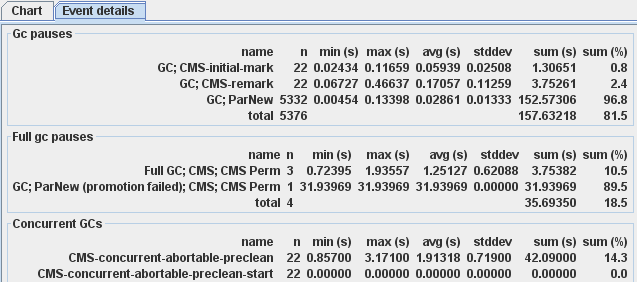
How to read this data?
Every name represents a type of event that was parsed. To clarify how the names are built, here a short part of a gc log file (Sun / Oracle java 1.6 CMS algorithm, a few details are omitted):
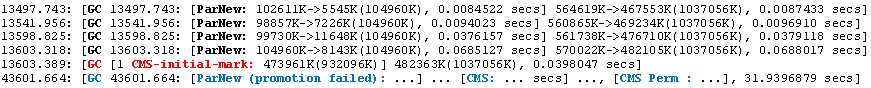
The text appearing in the "name" column is built of the bold parts of the lines above (the colour marks events of the same type). That's how "GC; CMS-initial-mark" and "GC; ParNew" were found. In the same way the name containing "promotion failed" was found. Since that event was the only one of its kind, you see the pause duration occuring as the value in all colums.
| column title | meaning of the column |
|---|---|
n |
number of events found |
min (s) |
duration of shortest event |
max (s) |
duration of longest event |
avg (s) |
average duration of all events |
stddev |
standard deviation |
sum (s) |
sum of the duration of all events |
sum (%) |
percentage of the total sum duration in the same block |
In the total line sum (%) means the percentage of the total pause that was spent for this group of events (81.5% for all "gc events" and 18.5% for all "full gc events"). |