-
Notifications
You must be signed in to change notification settings - Fork 32
climada viewer
muellele edited this page Dec 9, 2015
·
5 revisions
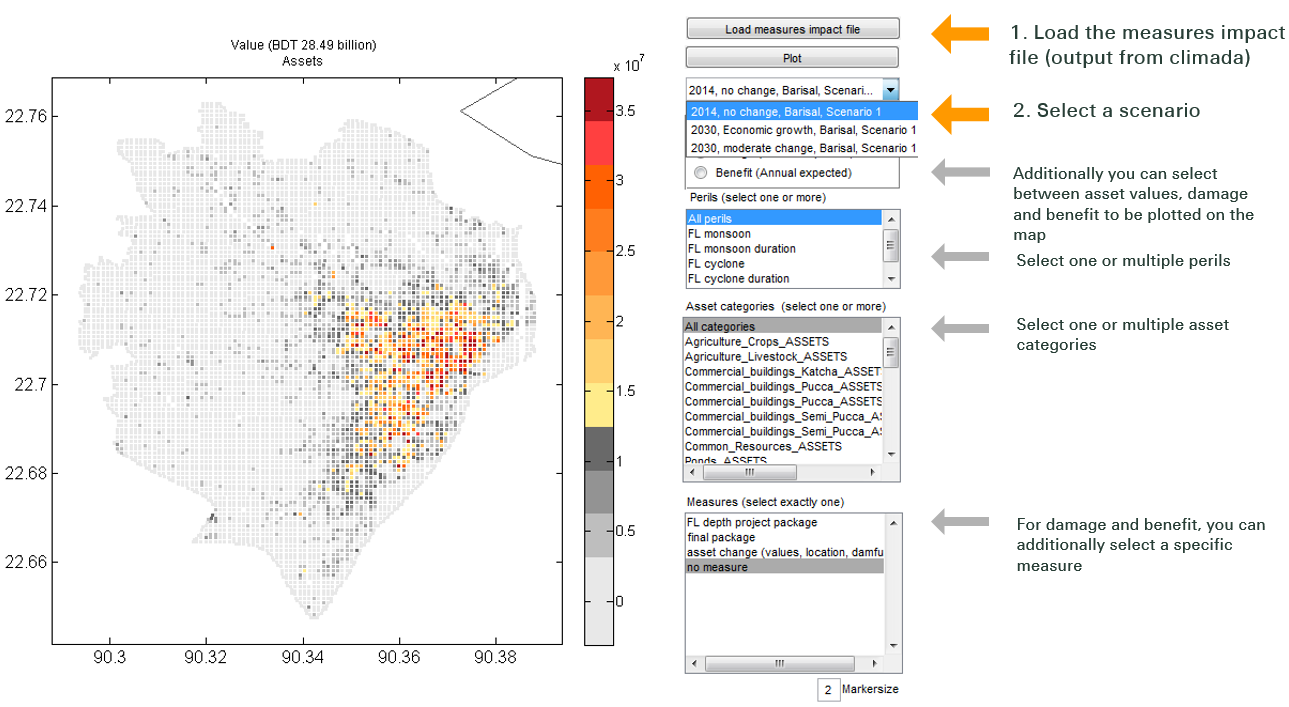
climada viewer is a simple GUI (graphical user interface) to plot assets, damage and benefits on a map. This is a nice way of visualizing input (asset value) and output (damage and benefit) from climada.
- Run climada: type startup in the command window
- Start the viewer: type climada_viewer in the command window
- Push the button "Load measures impact file" on the top right and select a file. For Barisal, select "measures_impact_2014_2030_2050_scenario_1.mat".

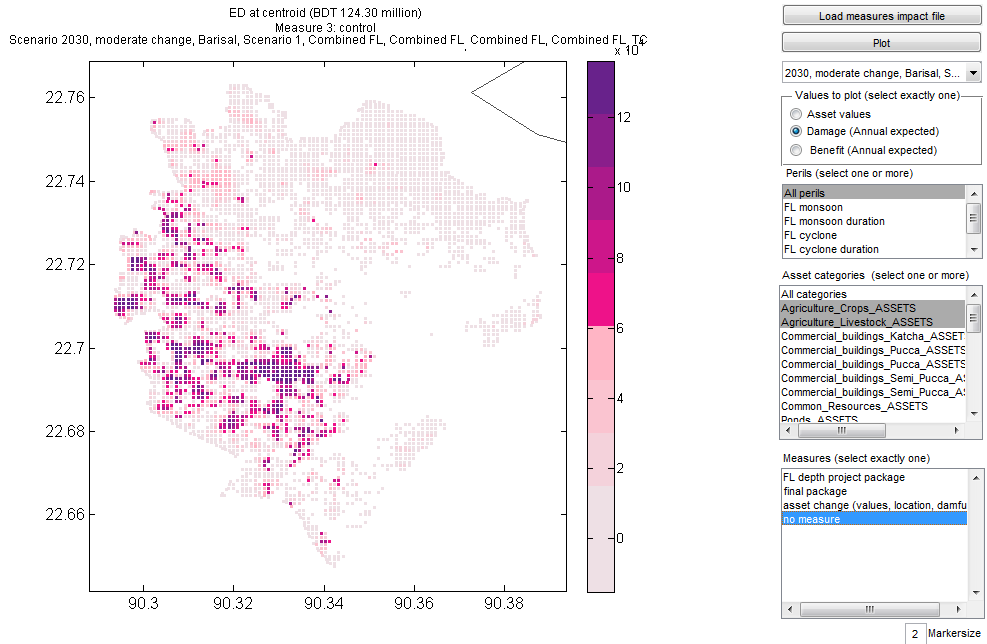
Agriculture in Barisal faces flood and cyclone damage mostly in the western part of the city. Damage adds up to BDT 124.3 million per year in 2030. 
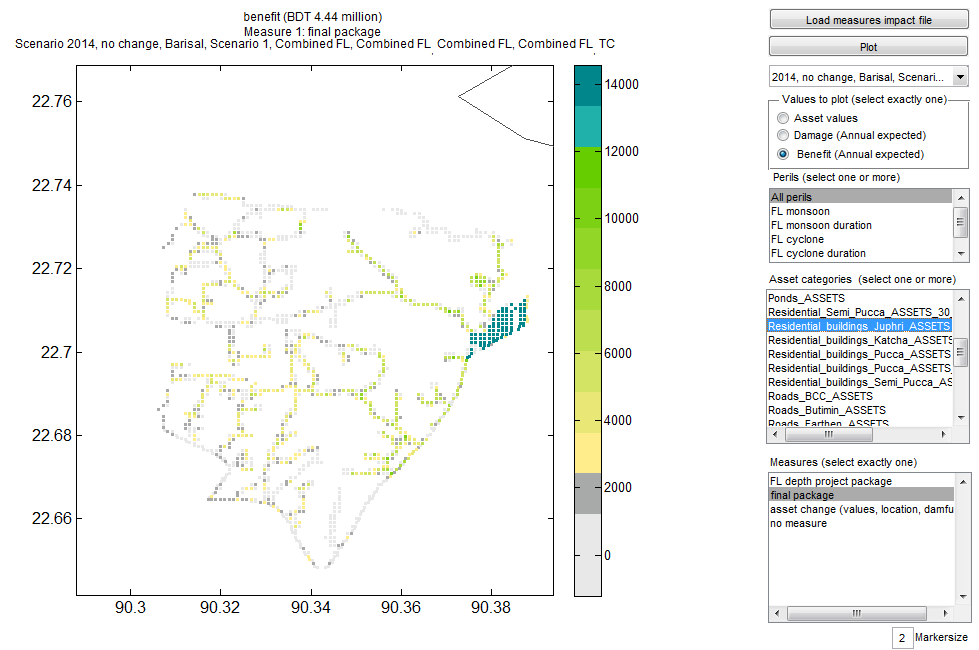
Juphri houses in Barisal are located closely to the Kirthonkola river and to Khals, which makes theses houses especially exposed to floods. Thanks to a package of measures (final package) BDT 4.4 million of damage can be avoided every year. Especially the Juphri houses in the North West can be effectively protected. 
The total climate risk in Barisal increases from today BDT 0.76 billion to 10.14 billion in 2050. With the total climate risk, we quantify today's weather and climate risks, the increase of populations and assets at risk due to economic development, plus the additional risk posed by climate change. You can produce this figure for any selection of perils and categories. 
Read the climada manual to get started.
copyright (c) 2015, David N. Bresch, david.bresch@gmail.com all rights reserved.