Unix-like general purpose spectral and rtlsdr processing utilities. Those utilities are designed for minimal resource requirements and dependencies. They can be built statically and do not require Python, GNU Radio or any heavy framework.
The set is composed of the following binaries:
avgfftReads the samples from an arbitrary sized uint_8 IQ file, integrates them, and converts them to frequency bins. Requires libfftw3.avgpwrReads samples from an RTLSDR dongle at a given frequency and sample rate, then computes their averaged power over a period of time.procReads the frequency/power values from a spectum and a reference file. Those files can be generated from either avgfft or from rtl_power_fftw if storing the IQ file isn't required.procthen performs the reference division, RFI removal, slope correction, conversion to radial velocity, and finally outputs the resulting valuesplotPlots the values from "proc" to a PNG file. Building requires golang and gonum/plot.plotis freestanding, it does not require GTK, QT, Cairo or any toolkit.radecTranslates ALT-AZ pointing coordinates to RA:DEC coordinates, which can be fed tovlsr. Requires libnova (static building is possible).pipeline.shFull pipeline demonstration. Acquires samples centered around the HI line, dumps it to a file, acquires a reference, runs avgfft, proc, then generates a plot. MISSING: VLSR correction. After feeding the data throughplot:
yfact.shCompute the Y factor of a device. Used to determine the system temperature (Tsys)
Those utilities are composable and can be used for many kinds of continuum and spectral analysis, using only the command line and shell scripts. Information and warnings are sent to stderr by default, redirecting it to /dev/null will only output the meaningful data. Those utilities can also work remotely and headlessly.
Tested on Linux/amd64 with both musl and glibc.
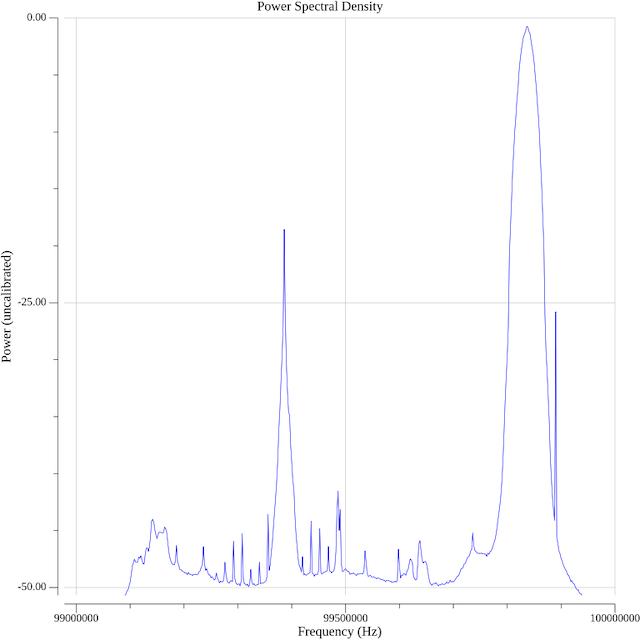
Plot FM spectrum
- Acquire 3 seconds of samples with rtl_sdr:
rtl_sdr -f 100000000 -n $((2048000 * 3)) output.bin
- Average the IQ samples to 1024 frequency bins (Fourier transform):
./avgfft output.bin -b 1024 > spectrum.txt
- Plot the result:
./plot -xlegend "Frequency (Hz)" -title "Power Spectral Density" spectrum.txt
Perform a survey
Use a for loop that will:
- Acquire samples to a file (ideally sitting on a RAMdisk):
for i in $(seq 1 1024); do rtl_sdr (...)
- For each samples batch, convert it to the frequency domain, then format the output to a row and append it to a file:
./avgfft output.bin | tr '\n' ' >> survey.txt
- After the loop is done, plot the resulting array using GNUplot:
plot survey.txt binary array=(2048,1441) format="%float64" with image notitle


