-
Notifications
You must be signed in to change notification settings - Fork 1.8k
New issue
Have a question about this project? Sign up for a free GitHub account to open an issue and contact its maintainers and the community.
By clicking “Sign up for GitHub”, you agree to our terms of service and privacy statement. We’ll occasionally send you account related emails.
Already on GitHub? Sign in to your account
series chart does not work as range chart #479
Comments
|
Are you using the same dimension for both charts? If so, crossfilter doesn't filter a group using the filter for its own dimension, only other dimensions. This allows us to show the entire nonfiltered data set so that you can see what a filter change would select. |
|
Yes, I used the same dimension. But I think it worked for the line chart and some previous versions. So I should use 2 dimensions whose setting are the same? could you please give me any sample code? |
|
@hudannis Using different dimensions based on the same crossfilter db should solve your issue. This has been open for three months, so I'm closing it for now, but feel free to reopen it (or use the mailing list) if you're still having trouble. |
|
I hacked series.html to have a rangeChart. But I still cannot get the brush filter to work. Any ideas? Here is the salient code: |
|
Here is a jsfiddle link: |
|
Hi @peterh2, you're right, this issue should not have been closed just because the original asker disappeared. |
|
This is really an instance of #390, just slightly less complicated. |
|
Thanks for looking in to this. Do you think that you will have some sort of fix for this any time soon? I would really like to use the 2.0 series chart if possible rather than reverting back to the 1.75 composite charts. If you think it is fixable in the next month or so, I will continue with 2.0. |
|
Unfortunately I am deep underwater in technical debt and can't make a promise about when this will be fixed. In response to your SO question I came up with a pretty complex workaround, but it exposes other bugs in dc.js - in particular #949 points just off the edge get clipped, which makes this example look particularly hideous. I'll publish my answer soon, still needs some explanation. Don't feel obligated to accept the answer as it is quite messy! |
|
#949 will definitely be fixed for 2.0 and I'm hoping to get to that in the next week or two. So, there is a solution, it's not a great one. The solution for this issue right here is quite a bit more complex and I don't have an ETA for it. |
it's still the wrong model, but calling filter twice
compounds the problem
for workaround for #479
composite charts make bad range charts currently
but this points the way to a workaround for now
it's still the wrong model, but calling filter twice
compounds the problem
for workaround for #479
composite charts make bad range charts currently
but this points the way to a workaround for now
it's still the wrong model, but calling filter twice
compounds the problem
for workaround for #479
composite charts make bad range charts currently
but this points the way to a workaround for now
|
I added an example based on the workaround I explained in this SO answer to @peterh2's question on the same topic, dc.js seriesChart doesn't seem to work with the rangeChart: http://dc-js.github.io/dc.js/examples/range-series.html It's pretty ugly but conceptually it's sound. Basically it makes one of the child charts the range chart instead of the whole composite chart. (Hmmmm, maybe that would have been an easier solution!) The trickier problem was that the composite chart was filtering each of its children twice, doing the filter null + filter range thing. Sometimes it seemed to land in the wrong place and end up with the filter null when there was a brush. This was inefficient anyway so I replaced it with a replaceFilter in the above commit. |
|
Fixed by #1408 in 3.0.2 |
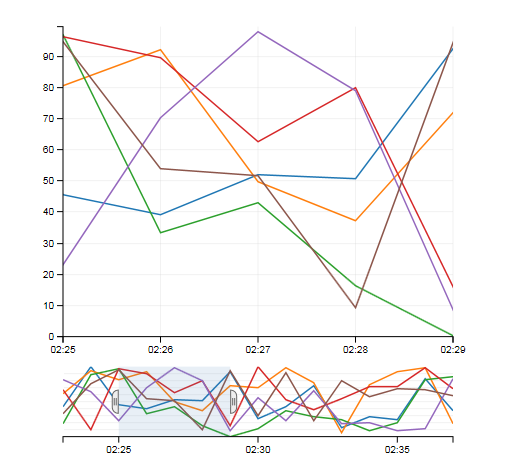
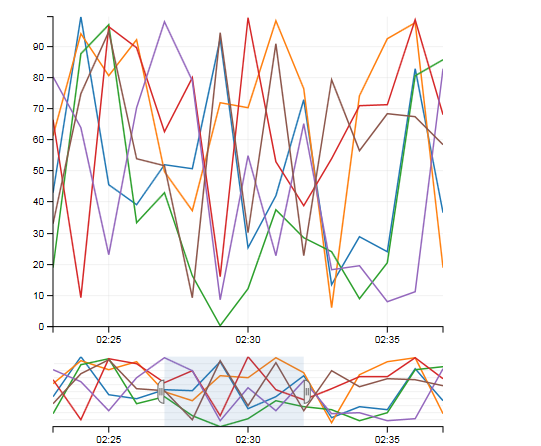
Hi, I am using seriesChart to draw multiple lines in one chart with a selecting chart. But it seems seriesChart doesn't work with rangeChart. I select a range by brush but the main chart doesn't change as expected.

expected image:
get the following image:

Moreover, if the mainchart can show the selected range of the indicator chart, can the data be selected correctly? Because the dimension for the seriesChart has two keys, while the filter getting by the selected range has only one key.
The text was updated successfully, but these errors were encountered: