-
Notifications
You must be signed in to change notification settings - Fork 31
New issue
Have a question about this project? Sign up for a free GitHub account to open an issue and contact its maintainers and the community.
By clicking “Sign up for GitHub”, you agree to our terms of service and privacy statement. We’ll occasionally send you account related emails.
Already on GitHub? Sign in to your account
chart_title doesn't title subplots
#1675
Comments
|
Not only that, but I'd expect |
|
|
|
The |
- Needed to add annotations for it
- Fixes deephaven#1675
- Needed to add annotations for it
- Fixes deephaven#1675
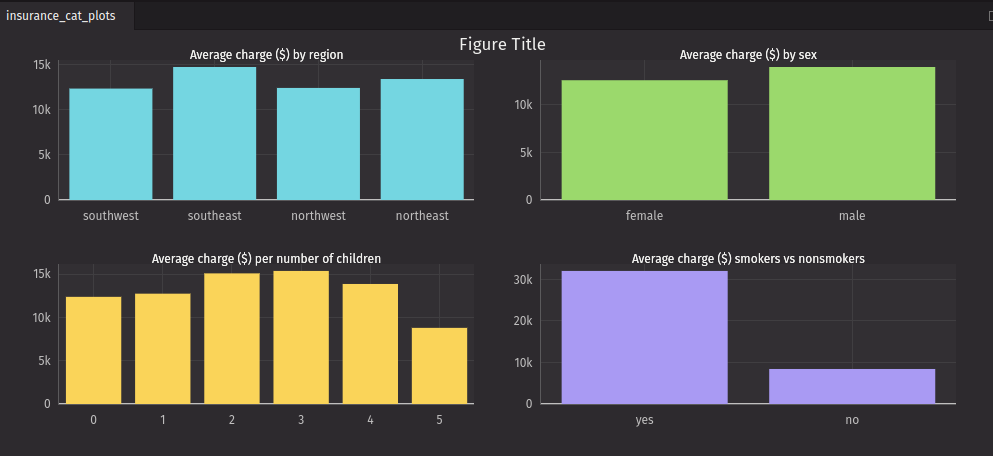
…1676) - Previously for some reason we were mapping the first subplot chart title to the figure title, which was incorrect. Instead map the Figure title attribute to the figure, and then chart title to the individual subplots - Annoyingly plotly doesn't have a chart title property, so we need to map these titles to `annotations` to get it to work correctly - Fixes #1674 , Fixes #1675 - Tested with the following snippet: ``` from deephaven.plot.figure import Figure from deephaven import read_csv insurance = read_csv("https://media.githubusercontent.com/media/deephaven/examples/main/Insurance/csv/insurance.csv") insurance_by_region = insurance.view(formulas=["region", "expenses"]).avg_by(["region"]) insurance_by_sex = insurance.view(formulas=["sex", "expenses"]).avg_by(["sex"]) insurance_by_children = insurance.view(formulas=["children", "expenses"]).avg_by(["children"]).sort(order_by=["children"]) insurance_by_smoker = insurance.view(["smoker", "expenses"]).avg_by(["smoker"]) insurance_cat_plots = Figure(rows=2, cols=2).\ new_chart(row=0, col=0).\ plot_cat(series_name="Region", t=insurance_by_region, category="region", y="expenses").\ chart_title(title="Average charge ($) by region").\ new_chart(row=0, col=1).\ plot_cat(series_name="Sex", t=insurance_by_sex, category="sex", y="expenses").\ chart_title(title="Average charge ($) by sex").\ new_chart(row=1, col=0).\ plot_cat(series_name="Children", t=insurance_by_children, category="children", y="expenses").\ chart_title(title="Average charge ($) per number of children").\ new_chart(row=1, col=1).\ plot_cat(series_name="Smoker", t=insurance_by_smoker, category="smoker", y="expenses").\ chart_title(title="Average charge ($) smokers vs nonsmokers").\ chart_legend(visible=False).\ figure_title("Figure Title").\ show() ``` 
Release notes https://github.com/deephaven/web-client-ui/releases/tag/v0.58.0

### Bug Fixes

* `figure_title` and `chart_title` were not mapped up correctly ([#1676](deephaven/web-client-ui#1676)) ([73e0b65](deephaven/web-client-ui@73e0b65)), closes [#1674](deephaven/web-client-ui#1674) [#1675](deephaven/web-client-ui#1675)


### Features

* "Group" column for rollup/tree tables ([#1636](deephaven/web-client-ui#1636)) ([ba1d51b](deephaven/web-client-ui@ba1d51b)), closes [#1555](deephaven/web-client-ui#1555)
* Add alt+click shortcut to copy cell and column headers ([#1694](deephaven/web-client-ui#1694)) ([4a8a81a](deephaven/web-client-ui@4a8a81a)), closes [deephaven/web-client-ui#1585](deephaven/web-client-ui#1585)
* Theming - Spectrum variable mapping and light theme ([#1680](deephaven/web-client-ui#1680)) ([2278697](deephaven/web-client-ui@2278697)), closes [#1669](deephaven/web-client-ui#1669) [#1539](deephaven/web-client-ui#1539)


---------

Co-authored-by: deephaven-internal <deephaven-internal@users.noreply.github.com>
Co-authored-by: mikebender <mikebender@deephaven.io>
Description
In the server-side Python API,
deephaven.plot.figure.Figure.chart_title()does not title a chart. Rather, it titles a figure. It does what I'd expectfigure_title()to do.Steps to reproduce
Expected results
A figure with four subplots, one with each title that's given in the code.
Actual results
A figure with four subplots, but only one title atop the figure itself. The first title is the one displayed, while the other three are not visible.
Additional details and attachments
Versions
The text was updated successfully, but these errors were encountered: