-
Notifications
You must be signed in to change notification settings - Fork 4.8k
New issue
Have a question about this project? Sign up for a free GitHub account to open an issue and contact its maintainers and the community.
By clicking “Sign up for GitHub”, you agree to our terms of service and privacy statement. We’ll occasionally send you account related emails.
Already on GitHub? Sign in to your account
[JIT] Improve inliner: new heuristics, rely on PGO data #52708
Conversation
|
@tannergooding Thanks for the feedback! Yeah it's early stage WIP but still open for any feedback :) |
PowerShell benchmarks:EgorPR vs Main (Default parameters)EgorPR vs Main (TieredPGO=1)EgorPR vs Main (TieredPGO=1 TC_QJFL=1 OSR=1)EgorPR vs Main (R2R=0 TieredPGO=1 TC_QJFL=1 OSR=1)EgorPR vs Main (R2R=0 TieredPGO=1 TC_QJFL=1 OSR=1)EgorPR (TieredPGO=1 TC_QJFL=1 OSR=1) vs Main (Default parameters)EgorPR (R2R=0 TieredPGO=1 TC_QJFL=1 OSR=1) vs Main (Default parameters) |
|
JSON deserialization ( [Benchmark]
public RootObj ParseTextJson() => JsonSerializer.Deserialize<RootObj>(TestFileBytes); |
61c7c91 to
98afcea
Compare
|
aspnet Kestrel microbenchmarks: (150 benchmarks) https://gist.github.com/EgorBo/719020f50575c34c146be535d44721ce |
…iner-improvements
|
Detailed PR descriptions like this are great for curious observers like me. Kudos! |
|
We usually base the acceptance criteria on citrine. I appreciate that you did you investigations on the small machines, but it will be preferable to share the final results from citrine here. Might be even better gains! Update: |
Initially I just wanted to tests some configs, didn't plan to publish any results, but the numbers looked too nice 🙂 I'll publish both Windows and Linux citrine once I validate some theories |
|
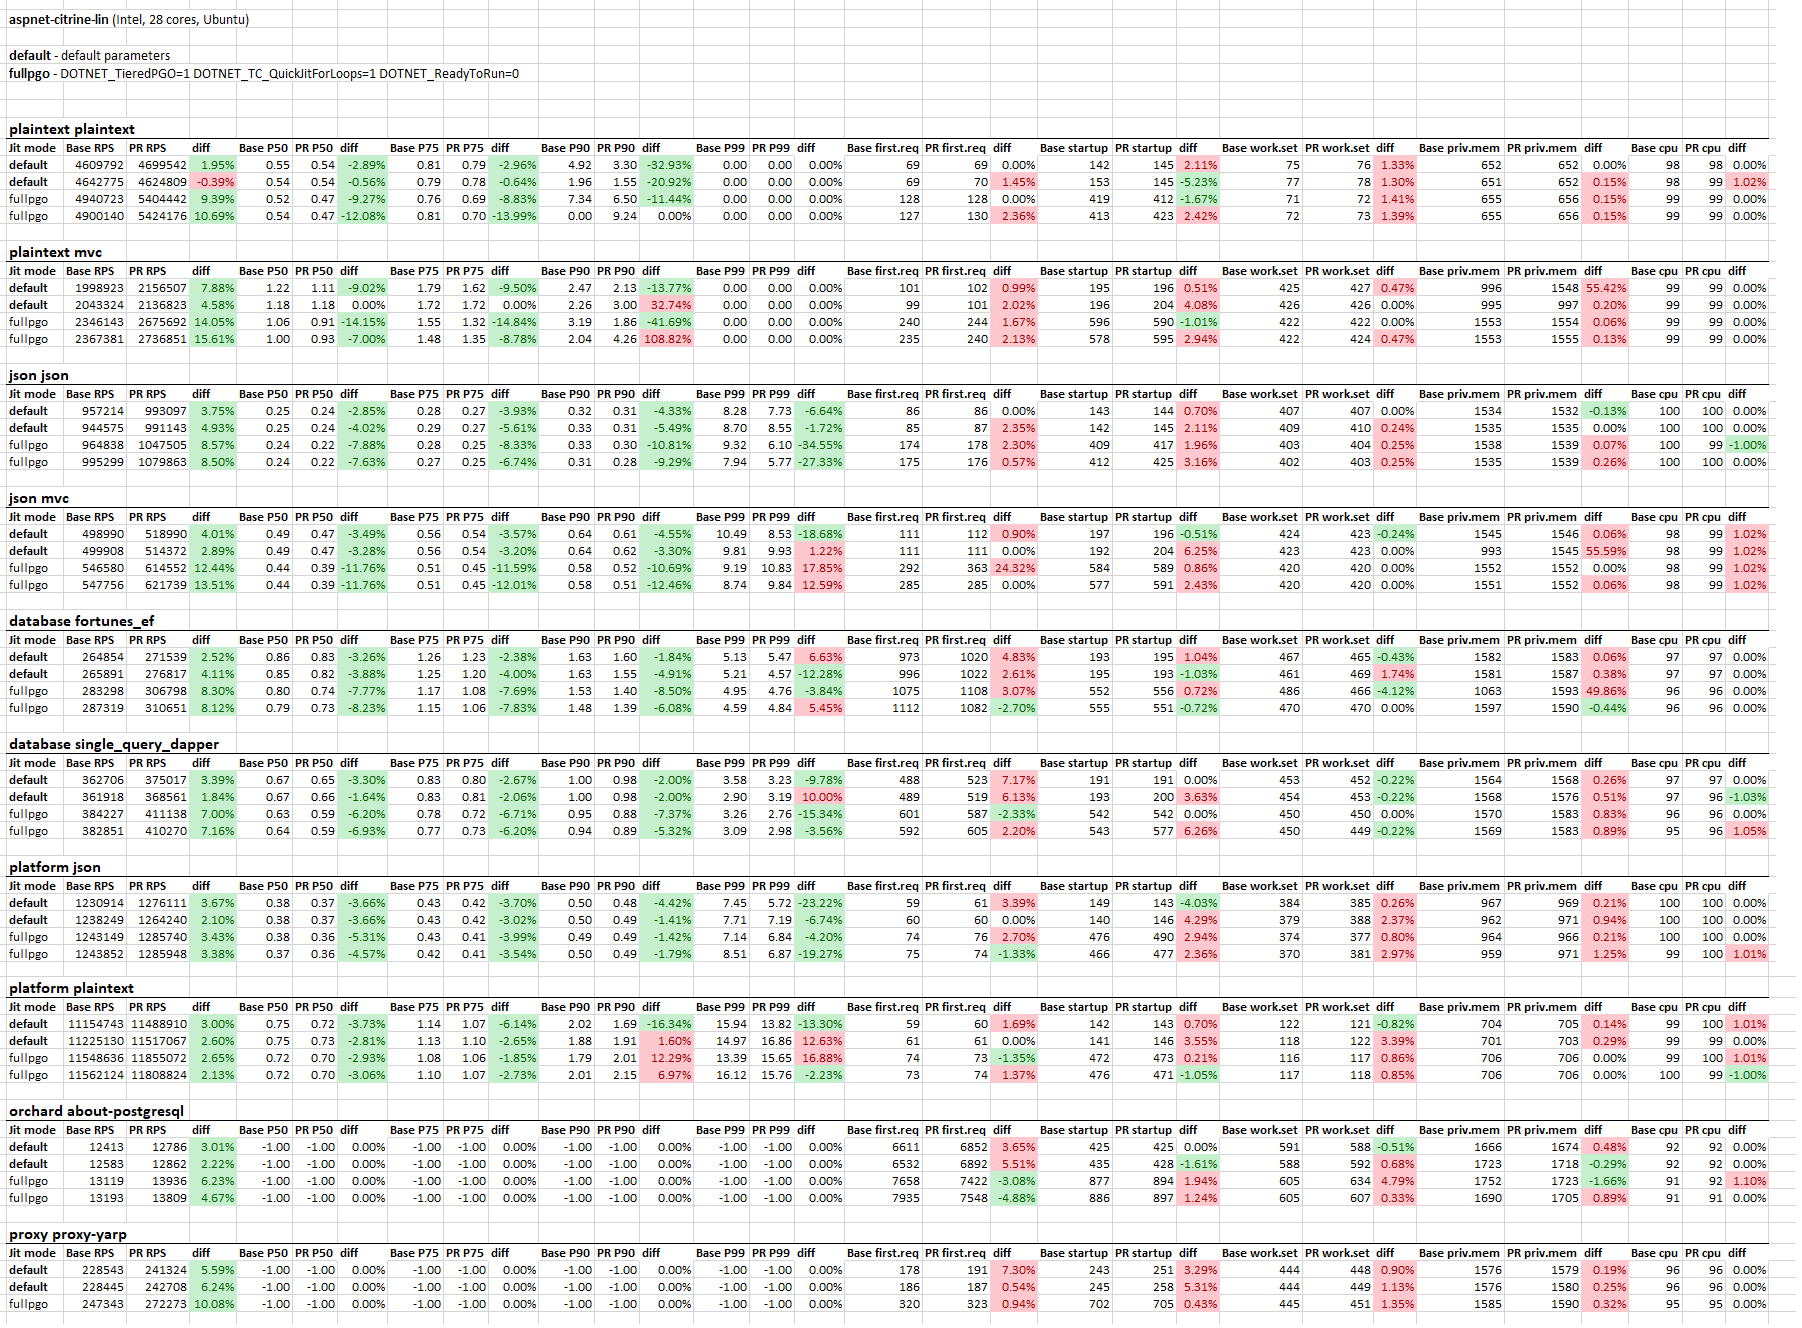
TE Benchmarks on aspnet-citrine-lin (Intel, 28 cores, Ubuntu 18.04) - the official TE hardware (except 4x bigger network bandwidth): Each config was ran twice, "Platform *" benchmarks were expected to have smaller diffs since they're heavily optimized by hands and mostly are limitted by OS/bandwidth but still quite some numbers. Let me know if I should also test some other configurations (e.g. Multiquery, etc). |
|
@jkotas Any objections to merging this? |
|
No objections. I think that the defaults for R2R can probably can use more tuning, but that can be done separately. @mangod9 @dotnet/crossgen-contrib The optimization for time ( |
|
Thanks, assume these the gains would be most pronounced with R2R composite mode? |
It depends. I would expect it to impact both composite and non-composite cases. |
|
It can be merged then. This PR mostly unlocks dynamic PGO's potential that we won't use by default in .NET 6. However, users, who care less about slower start, can set the following variables for "FullPGO + Aggressive Inliner" mode: DOTNET_TieredPGO=1 # enable PGO instrumentation in tier0
DOTNET_TC_QuickJitForLoops=1 # don't bypass tier0 for methods with loops
DOTNET_ReadyToRun=0 # don't use prejitted code and collect a better profile for everything
DOTNET_JitExtDefaultPolicyMaxIL=0x200 # allow inlining for large methods
DOTNET_JitExtDefaultPolicyMaxBB=15 # same here
DOTNET_JitExtDefaultPolicyProfScale=0x40 # try harder inlining hot methodsHere are the results for TE benchmarks on citrine-linux for This PR also improves the default mode, but only by a few %s in general. And, just a reminder: if we use/benchmark something with What is not done, but nice to have:
If something goes wrong we can easily switch to the previous (more conservative and PGO-independent) policy. |
…iner-improvements
|
The example from #33349 is my favorite one: private static bool Format(Span<byte> span, int value)
{
return Utf8Formatter.TryFormat(value, span, out _, new StandardFormat('D', 2));
}Diff: https://www.diffchecker.com/WFVcKhJm (973 bytes -> 102 bytes) |
|
Failure is unrelated (#54125) |


Closes #33338 optimize comparisons for const strings
Closes #7651 Generic Type Check Inlining
Closes #10303 have inlining heuristics look for cases where inlining might enable devirtualization
Closes #47434 Weird inlining of methods optimized by JIT
Closes #41923 Don't inline calls inside rarely used basic-blocks
Closes #33349 Utf8Formatter.TryFormat causes massive code bloat when used with a constant StandardFormat
This PR was split, the first part is #53670
Inlining is one of the most important compiler optimizations - it significantly widens opportunities for other optimizations such as Constant Folding, CSE, Devirtualization, etc. Unfortunately, there is no Silver Bullet to do it right and it's essentially a sort of an NP complete Knapsack problem, especially in JIT environments where we don't see the whole graph of all calls, new types can be loaded/added dynamically, and we're limited in time, e.g. we can't just try to import all the possible callees into JIT's IR nodes, apply all the existing optimizations we have and decide whether it was profitable or not - we only have time to quickly inspect raw IL and note some useful patterns (furthermore, we ask R2R to bake "noinline" into non-profitable methods forever).
It's important to note possible regressions due to bad Inlining decisions:
lclMAX_TRACKED=512) - a good example is this sharplab.io snippet.Current approach in RyuJIT
In RyuJIT we have several strategies (or policies) such as
DefaultPolicy,ModelPolicy(based on some ML model to estimate impact),SizePolicy(prefers size over perf) andProfilePolicy(heavily relies on PGO data). But onlyDefaultPolicyis used in Production. Its algorithm can be explained in 5 steps:AggressiveInliningattribute - always inlineNoInlinine- always ignorebool toInline = callsiteNativeSize * BenefitMultiplier > calleeNativeSizeAn example with logs:
(BTW, in this PR this method is inlined)
Things this PR tries to improve
idiv.typeof(T1) == typeof(T2)orargStr.Length == 10whenargStris a string literal at the callsite. (NOTE: only during prejitting or when a method was promoted to tier1 naturally. Won't work for methods with loops or with TieredCompilation=0).A small example that covers some of the new observations inliner makes:
Thanks to @tannergooding's work we can now resolve some
calltokens and recognize intrinsics.Refactor
fgFindJumpTargetandPushedStack: We pushed opcodes to that two-slots stack in order to recognize some patterns in the next (binary/unary) opcodes - unfortunately we ignored a lot of opcodes and it led to invalid state in that stack => invalid observations. Such invalid observations were the main source of regressions in my PR because some of them led to a better performance for some reason 😐.Find more optimal multipliers for the observations (using micro/TE benchmarks, deep performance analysis of traces/regressions, example: [JIT] Improve inliner: new heuristics, rely on PGO data #52708 (comment)).
Rely on PGO data - the most important part. We try harder to inline what was recognized as hot. Unfortunately, there are cases where a profile can be misleading/polluted and mark hot or semi-hot blocks as cold:
Allow JIT to inline bigger functions if really needed: more than 5 basic-blocks and more than 100 bytes of IL.
Metodology
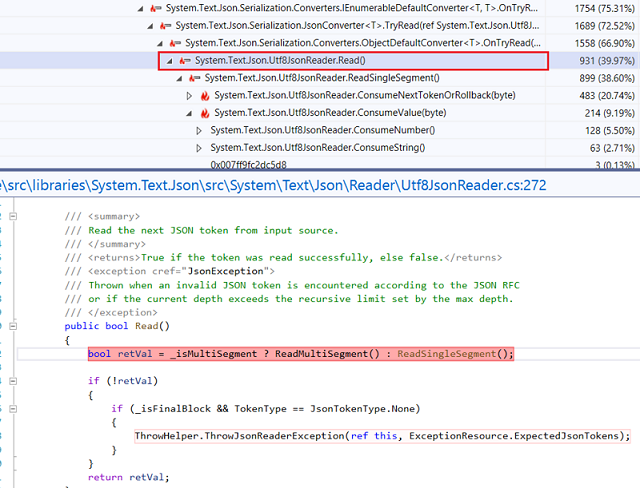
For now, I mostly run various benchmarks (TE, dotnet/performance, PowerShell, Kestrel, SignalR), analyze collected samples (flamegraphs) produced by profilers/dotnet trace/BDN itself in hot spots where I inspect all calls in the chains and if I see a method that looks like it should be inlined - I try to find what kind of observations (and corresponding benefit multipliers) can make it happen, example:

There are some thoughts on how to automatize it using ML/Genetic Algorithms.
Benchmarks
I use PerfLab machines for TE/SignalR/YARP benchmarks. Besides that, I have locally:
Also, I use different JIT modes:
DOTNET_TieredPGO=1- collect profile in tier0.DOTNET_TC_QuickJitForLoops=1- so we also instrument methods with loops on tier0. By default they bypass tier0 to avoid "cold loops with hot bodies" problem (OSR is not enabled by default yet).DOTNET_ReadyToRun=0- ignore all AOT code and re-collect actual profile (with better class probes).Results
It seems like this PR unlocks PGO and GDV potential in FullPGO mode. Many high-load benchmarks show +10-20% improvements. I tried to avoid startup/time-to-first-request regressions in the Default mode so the RPS numbers are not as great as they could be with a more aggressive inliner. In order to avoid size regressions in R2R, we use the "old" inliner - it leads to zero improvements when we benchmark R2R'd code in
DOTNET_TieredCompilation=0mode (e.g.dotnet/performancemicrobenchmarks). Also, prejitter bakes "noinline" into thousands of method using the old algorithm and kind of limits possibilities for the new one during prejitting.The latest run of TE benchmarks on aspnet-citrine-lin:

^ some P90-P99 numbers regressed because, I believe, they include the warmup stage, so when I try to run a specific benchmark and ask it to run longer than 30 seconds - P99 numbers are greatly improved)
Also, don't expect large numbers from Platform-* benchmarks, those are heavily optimized by hands 😐.
UPD: the latest numbers: #52708 (comment)
NoPGO vs FullPGO (mainly to estimate impact of PGO and show room for improvements for the Default mode, NOTE: NoPGO numbers should be slightly better than the current results for .NET 5.0 in the Default mode):
 UPD new numbers: #52708 (comment)
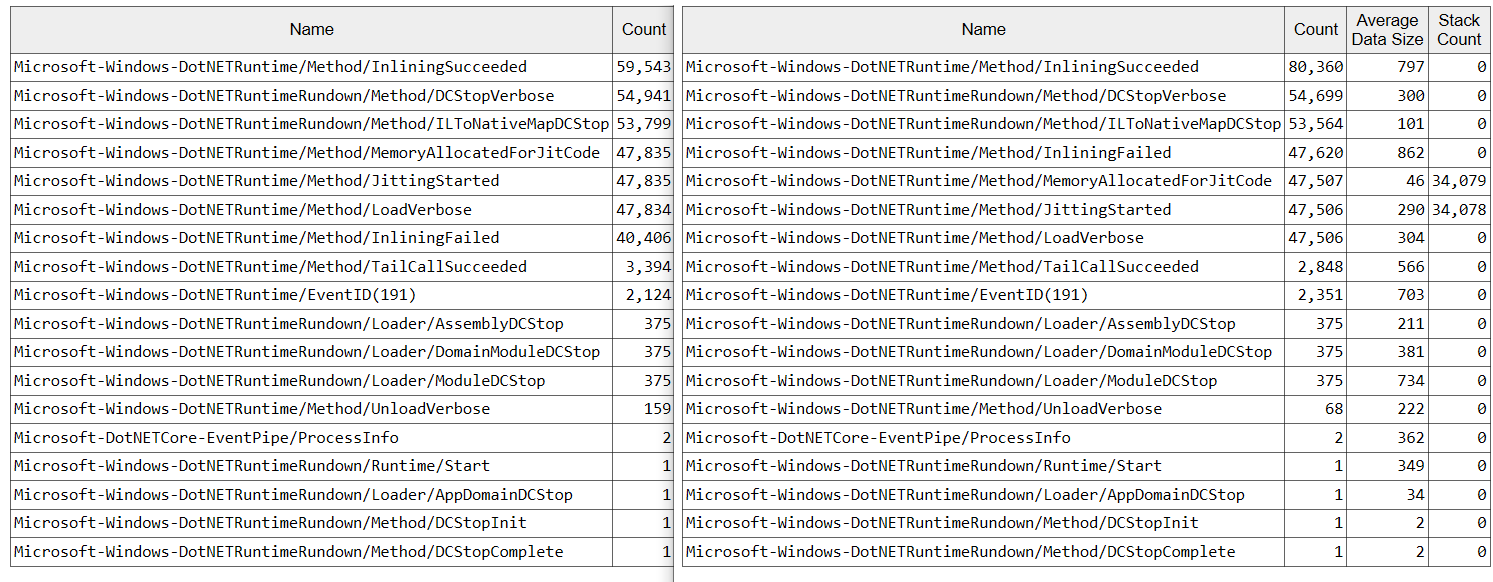
JIT ET events show that the improved inliner usually inlines 10-20% more functions, e.g.:

Plaintext-MVC (Default mode):
Orchard CMS (Default mode):

YARP Proxy (Default mode):
