-
Notifications
You must be signed in to change notification settings - Fork 4
New issue
Have a question about this project? Sign up for a free GitHub account to open an issue and contact its maintainers and the community.
By clicking “Sign up for GitHub”, you agree to our terms of service and privacy statement. We’ll occasionally send you account related emails.
Already on GitHub? Sign in to your account
Reformat csv reading and plot the number of instances being used throughout the hypothesis validation process #84
Comments
Due to some modifications to the csv output #84 is being renamed
|
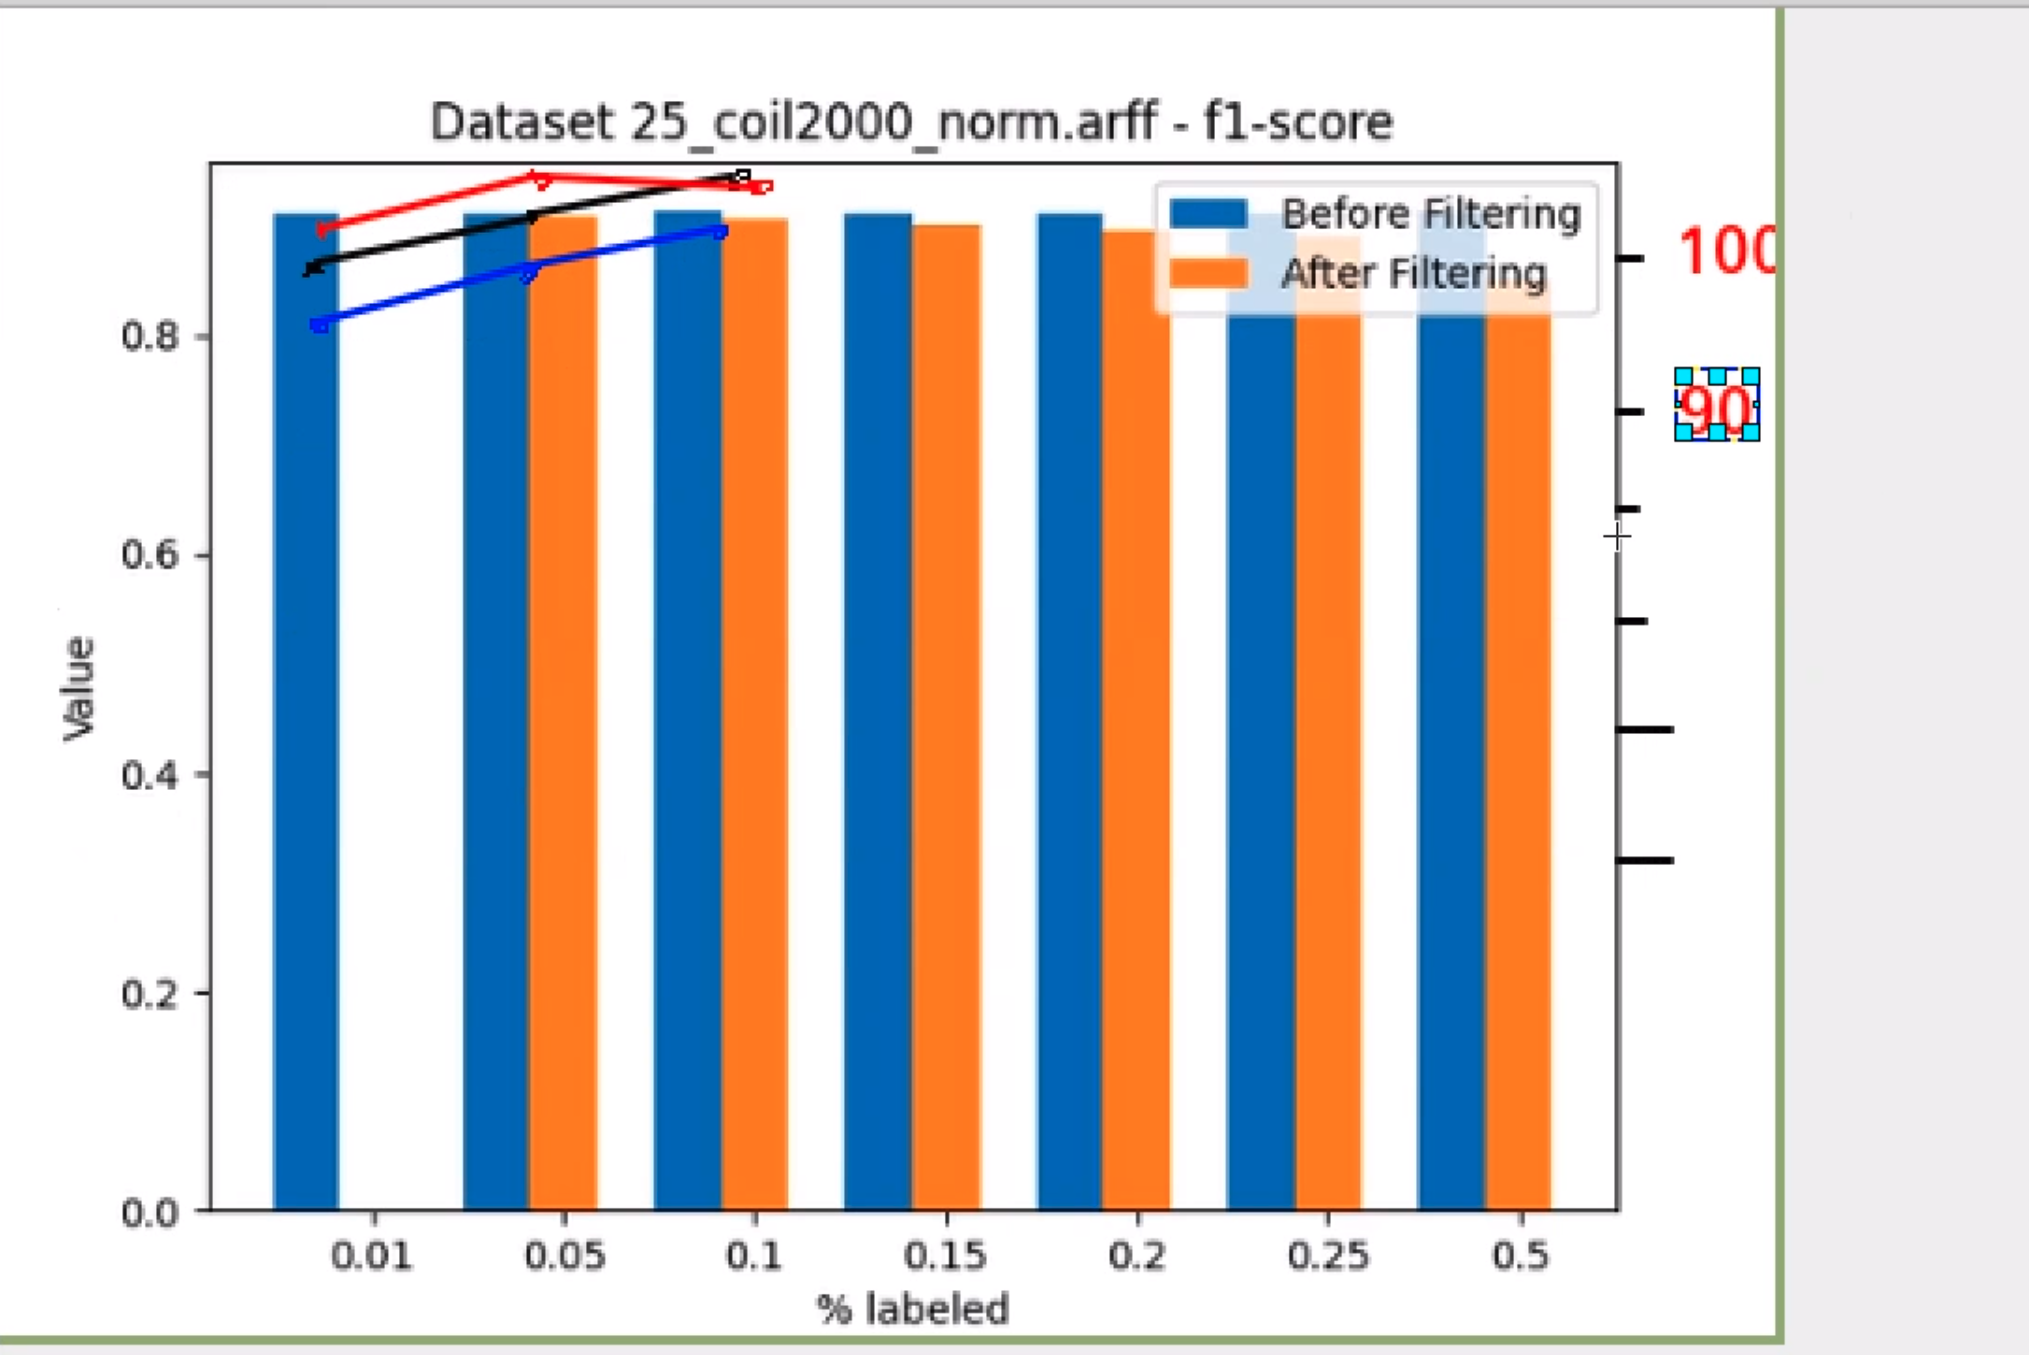
I am not sure about the names... I think we should have:
|
|
You mean on the right legend, is that correct? |
|
Something like this @alvarag? |
|
Yes, that is what I wanted to see. The problem is that ENN is fitlering instances of the original dataset, thus it is worsening the performance |
|
Nevertheless, both the "Banana" and the "Iris" datasets have been used as tests to check that all the code worked correctly. I am currently running the experimentation on all the datasets we have in order to have a wider range of results. |
Refactored legend names for clarification #84


The basic idea is to add a new metric on the right of the current plot. A handmade of the desired result is the following.

The text was updated successfully, but these errors were encountered: