Script for generating a dynamic spectrogram from an audio file Now supports multipaged videos with sliding highlight (akin to Audition)
Workflow:
- Tweak your spectrogram settings using the testSpec() function, storing results in variable
- Feed variable into rspectVid to generate dynamic spectrogram -It does this by exporting a PNG of the testSpec() ggplot function; -Import PNG as a new ggplot raster layer -Overlay a series of translucent highlight boxes that disolve away using gganimate
- Note, you will need ffmpeg installed to take full advantage of this code.
- If you have a Mac, with homebrew installed, you can install ffmpeg easily by opening terminal and entering:
brew install ffmpeg
Example usage:
require(devtools)
source_url("https://raw.githubusercontent.com/drwilkins/rspectVid/master/rspectVid.R")
#takes .wav or .mp3
params<-testSpec("data/Femalebarnswallow1.wav", onlyPlotSpec=F)
ggsave("web/femStaticSongSpec.png",params$spec[[1]])
rspectVid(params,vidName="femDynamicSongSpec",destFolder="web/")
#exports an .mp4 to the same file directory by default
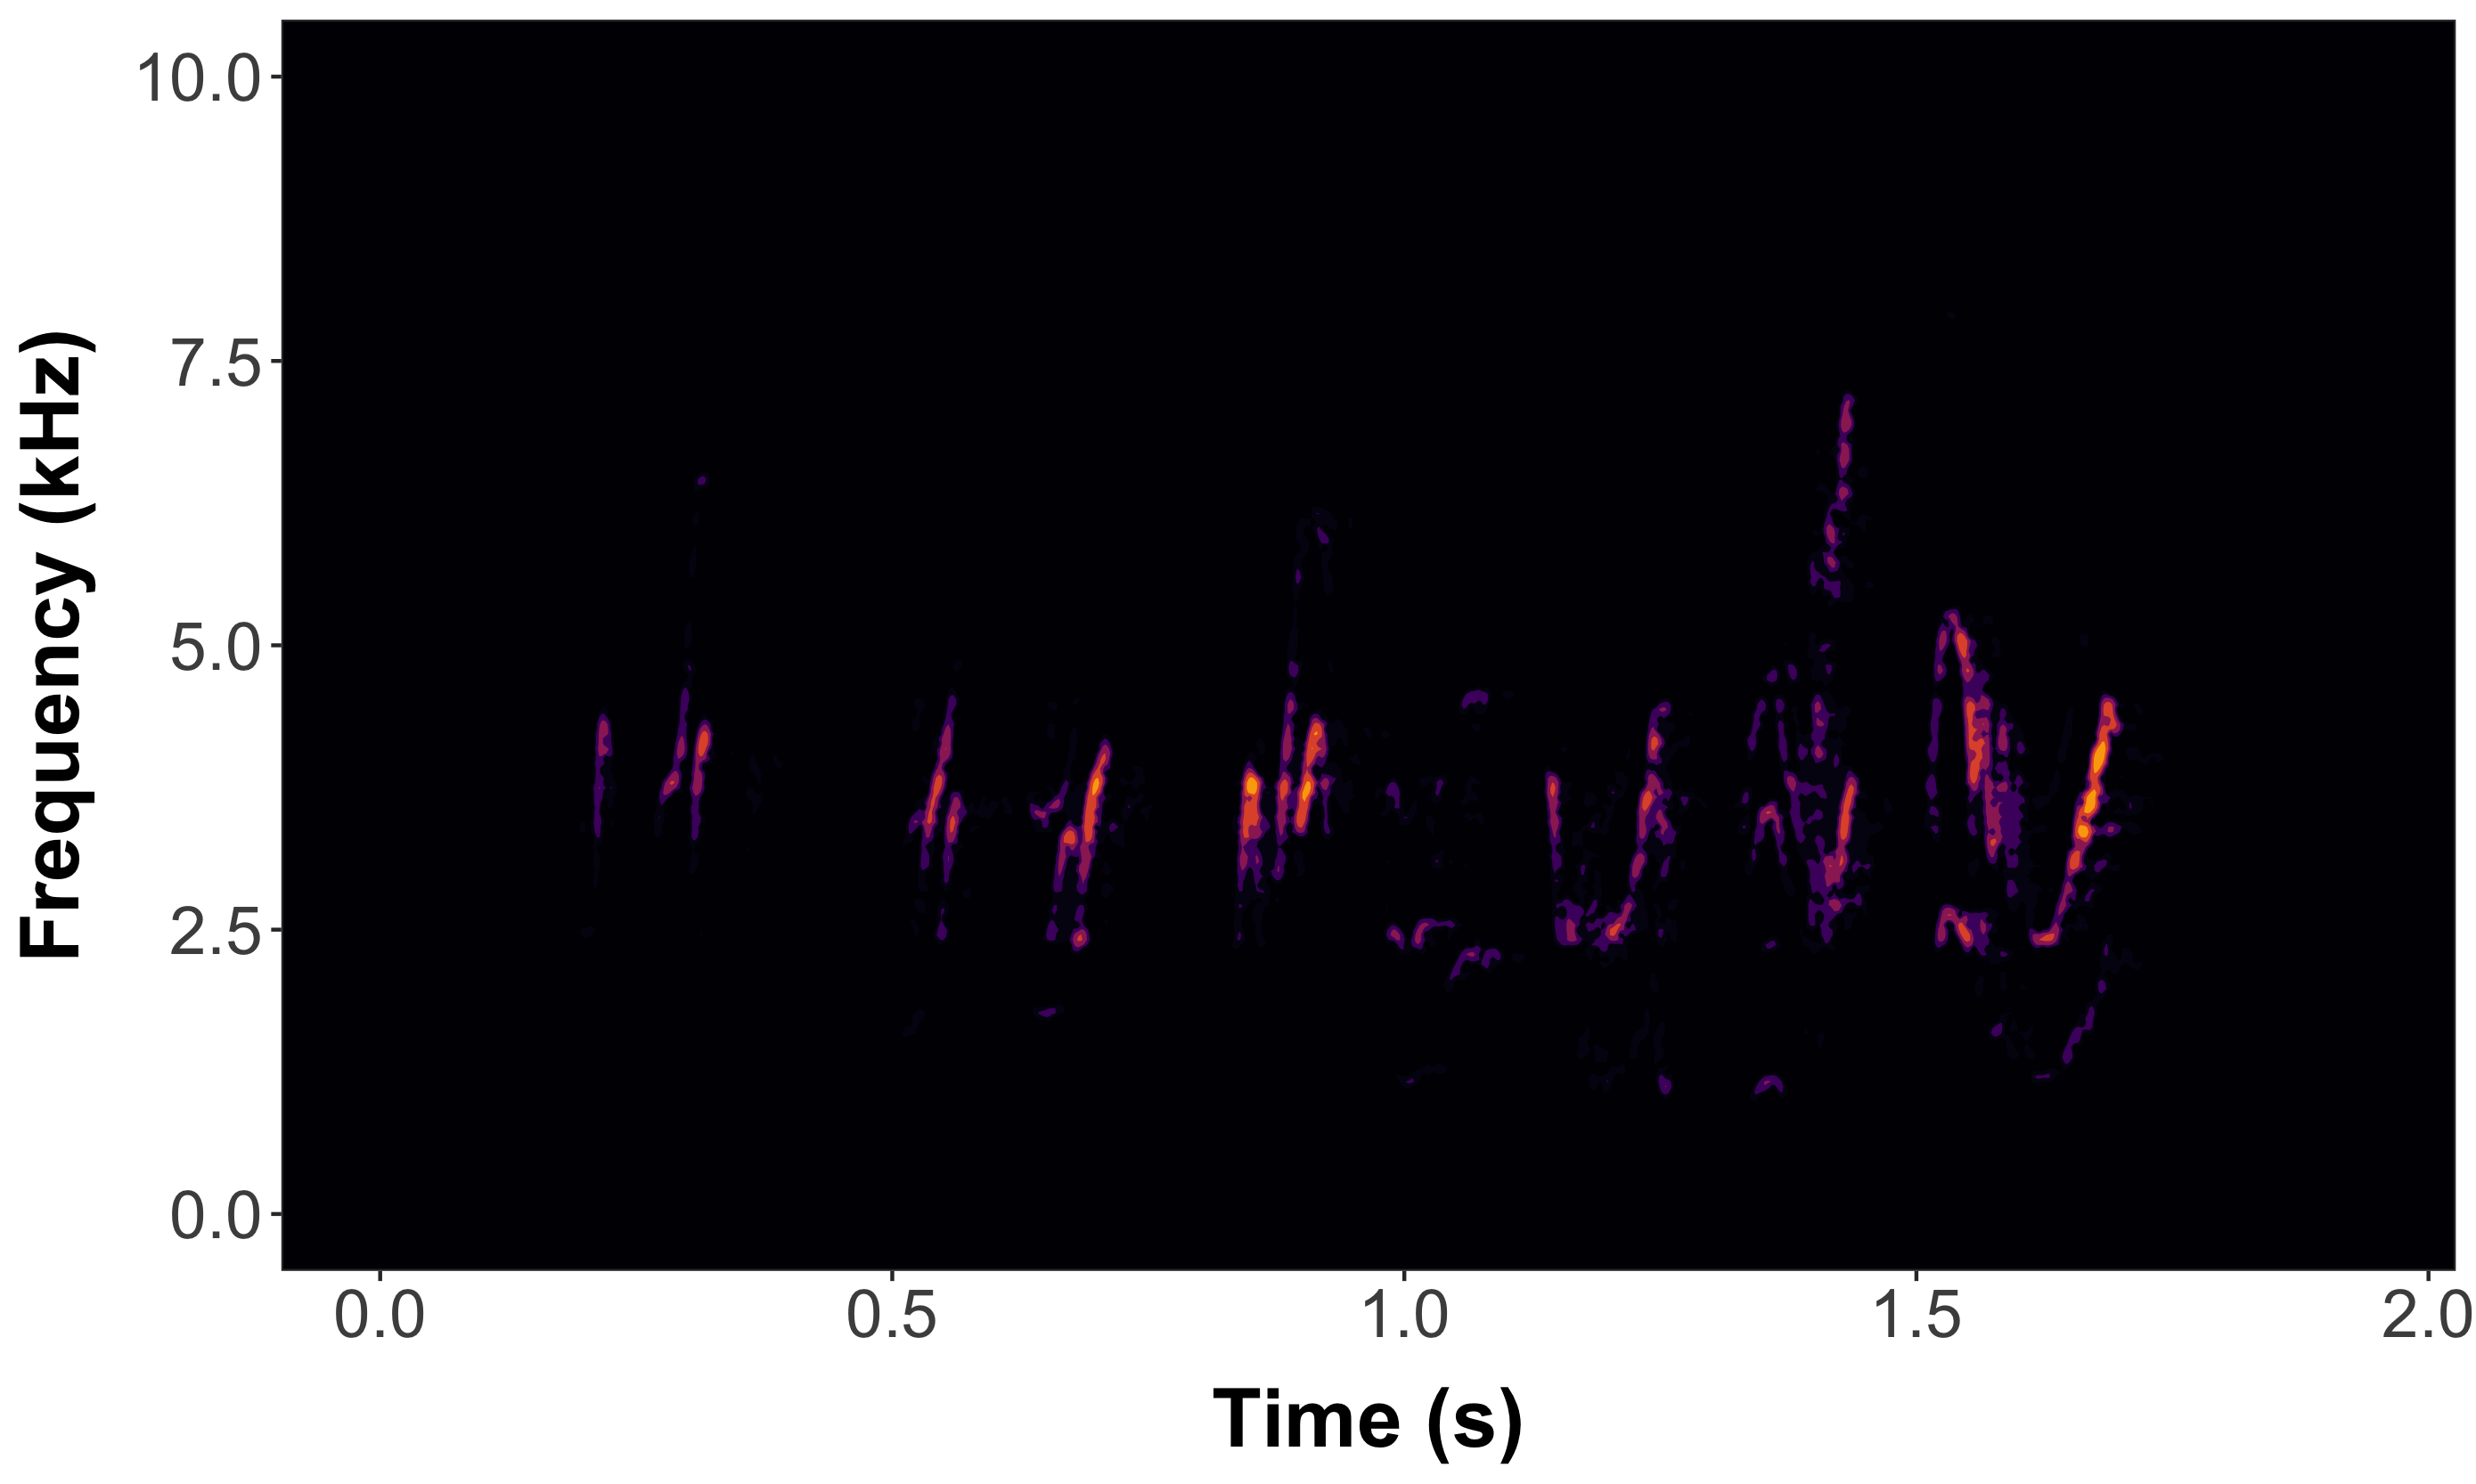
- ampTrans=3 is a nonlinear signal booster. Basically collapses the difference between loudest and quietest values (higher values= brighter specs); 1 (default) means no transformation
- Here, I also lowered the decibel threshold to include some quieter sounds with min_dB=-35; default is -30
- bgFlood=T makes the axis area the same color as the plot background. It will automatically switch to white axis font if background is too dark.
p2<-testSpec("data/Femalebarnswallow1.wav",min_dB=-35, onlyPlotSpec=F,bgFlood=T,ampTrans=3)
rspectVid(p2,destFolder="web/")
Now also supports .mp3 files (web or local) and multi-page dynamic spectrograms (i.e. cropping and segmenting spectrograms from larger recording files)
- Long files may take a long time to render, depending on CPU power...
- the default is to not plot axes and labels (onlyPlotSpec=T)
- crop=12 is interpreted as: only use the first 12 seconds of the file; can also specify interval w/ c(0,12)
- xLim=3 specifies the "page window" i.e. how many seconds each "page" of the dynamic spectrogram should display, here 3 sec
- here we also limit the yLim of the plot to the vocalized frequencies from 0 to 700 Hz (0.7 kHz)
p<-testSpec("http://www.oceanmammalinst.org/songs/hmpback3.wav",yLim=c(0,.7),crop=12,xLim=3,ampTrans=3)
ggsave("web/humpback.png", height=2, width=6)
rspectVid(p,destFolder="web/",delTemps=F)
#Voila 🐋

Example using Xeno-Canto to generate a multi-page dynamic spectrogram of a common nighthawk call (w/ different color scheme)
song="https://www.xeno-canto.org/sounds/uploaded/SPMWIWZKKC/XC490771-190804_1428_CONI.mp3"
n=testSpec(song,crop=20,xLim=4,colPal = c("white","black"))
rspectVid(n,vidName="nightHawk" ,highlightCol = "#d1b0ff",cursorCol = "#7817ff",destFolder="web/")
### Nighthawk multipage dynamic spec
<iframe src="https://player.vimeo.com/video/432724657" style="border:0px; width: 100%;" height=303 width=910 margin="0" padding="0" frameborder="0" allow="autoplay; fullscreen" allowfullscreen></iframe>