[Security Solution] [Elastic AI Assistant] Include acknowledged alerts in the LangChain AlertCountsTool aggregation
#173701
Conversation
…alerts in the LangChain `AlertCountsTool` aggregation This PR updates the LangChain `AlertCountsTool` aggregation, which answers questions like `How many open alerts do I have?`, to include `acknowledged` alerts. The `AlertCountsTool` was introduced as part of [[Security Solution] [Elastic AI Assistant] Retrieval Augmented Generation (RAG) for Alerts elastic#172542](elastic#172542) - This PR is similar to <elastic#173121>, where `acknowledged` alerts were added to the `OpenAndAcknowledgedAlertsTool`, which returns the _details_ of alerts - In contrast to [elastic#173121](elastic#173121), this PR is focused on the alert counts _aggregation_ - This PR also updates the `range` of **both** the `AlertCountsTool` and the `OpenAndAcknowledgedAlertsTool` queries to standardize on the following syntax, which aligns with the `Last 24 hours` option in the _Commonly used_ section of the Kibana date picker: ```json "range": { "@timestamp": { "gte": "now-24h", "lte": "now" } } ``` ### Desk testing To desk test this change: - The `assistantRagOnAlerts` feature flag described in [elastic#172542](elastic#172542) must be enabled, per the following example: ``` xpack.securitySolution.enableExperimental: ['assistantRagOnAlerts'] ``` - The `Alerts` feature must be enabled in the assistant settings, per the screenshot below: 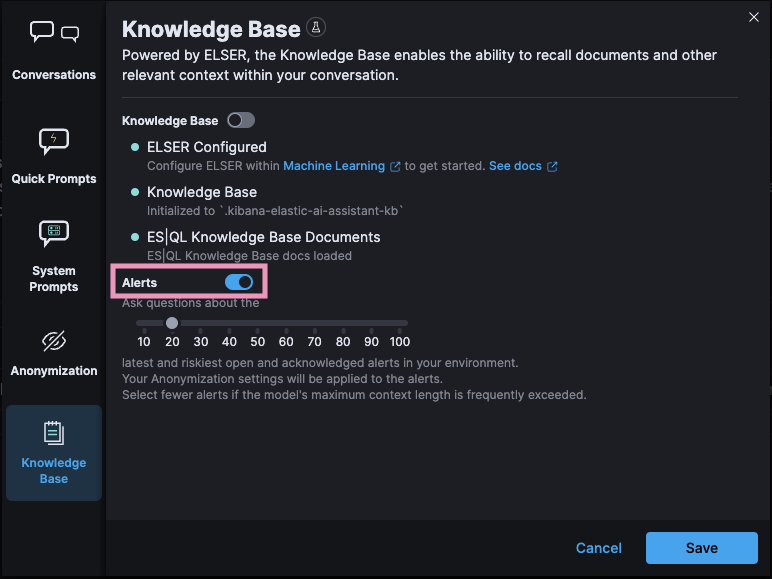 1) Generate alerts with a variety of severity (e.g. `low`, `medium`, `high`, and `critical`) 2) After the alerts have been generated, disable all detection rules to keep the counts static during testing 3) Navigate to Security > Alerts 4) Select `Last 24 hours` from the _Commonly used_ section of the global date picker 5) Click the `Treemap` button to select the Treemap visualization 6) In the Treemap's `Group by` input, enter `kibana.alert.severity` 7) Next, in the Treemap's `Group by top` input, enter `kibana.alert.workflow_status` 8) Click the `AI Assistant` button to open the assistant 9) Click the `X` button to clear the conversation 10) Close the assistant 11) Add the following two fields as columns to the Alerts page table: ``` kibana.alert.workflow_status _id ``` 12) Sort the Alerts table, first by `kibana.alert.risk_score` from high to low, and then by `@timestamp` from new to old, per the screenshot below:  **Expected results** - The alerts page date range is `Last 24 hours` - The `Treemap` is selected - The treemap is grouped by `kibana.alert.severity` and then `kibana.alert.workflow_status` - The alerts table has custom sorting and columns, per the screenshot below:  13) Click the `AI Assistant` button to open the assistant 14) Ask the assistant: ``` How many open alerts do I have? ``` **Expected results** - The assistant will report on the counts and workflow status of alerts, per the example response and screenshot below: ``` You have a total of 47 open alerts. Here's the breakdown: 24 alerts with low severity, 12 alerts with medium severity, 7 alerts with high severity, and 4 alerts with critical severity. ```  15) Make note of the counts shown in the assistant, then close the assistant Expected result: - The counts from the assistant match the counts in the treemap legend, per the example screenshot below:  16) Change the workflow status of an alert in the Alerts table from `open` to `acknowledged` **Expected result** - The treemap and alerts table and include the updated (`acknowledged`) alert, per the screenshot below:  17) Once again, open the assistant 18) Once again, ask the (same) question: ``` How many open alerts do I have? ``` **Expected result** - The response from the assistant makes reference to the alert who's workflow status was changed from `open` to `acknowledged`, per the example response and screenshot below: ``` Based on the latest data I had received, you have a total of 47 open alerts. Here's the breakdown: 24 alerts are of low severity, 12 alerts are of medium severity, 7 alerts are of high severity, and 4 alerts are of critical severity (Note: One of the critical severity alerts has been acknowledged). ``` 
|
Pinging @elastic/security-solution (Team: SecuritySolution) |
💚 Build Succeeded
Metrics [docs]
To update your PR or re-run it, just comment with: |
There was a problem hiding this comment.
Code review and desk testing LGTM!
As discussed offline, we noticed a discrepancy between the time being selected and the time being searched in both Security Solution and Discover. It seems something in the date picker converts relative dates to absolute. This may be a hit to performance and caching, even if it was searching the correct time. Relative is more performant in ES. It gets worse - not only is the time absolute, but the time picker rounds down to the hour. So if you searched the last 24 hours at 9:59 today, it would give you a range of Tues 9:00 - Wed 9:59. A 25 hour period. We are not sure when this started, but we will research and see if this is a bug as we suspect.

In regards to this PR, I think we are good going forward with now-24h for this query and investigating the issue with the date picker separately.
Thanks for sharing this observation @stephmilovic! I happened to have an
For example,
Above: Discover's URL encoding of
Above: Discover's query encoding of |


💔 All backports failed
Manual backportTo create the backport manually run: Questions ?Please refer to the Backport tool documentation |
💚 All backports created successfully
Note: Successful backport PRs will be merged automatically after passing CI. Questions ?Please refer to the Backport tool documentation |

…rts in the LangChain `AlertCountsTool` aggregation (elastic#173701) This PR updates the LangChain `AlertCountsTool` aggregation, which answers questions like `How many open alerts do I have?`, to include `acknowledged` alerts. The `AlertCountsTool` was introduced as part of [[Security Solution] [Elastic AI Assistant] Retrieval Augmented Generation (RAG) for Alerts elastic#172542](elastic#172542) - This PR is similar to <elastic#173121>, where `acknowledged` alerts were added to the `OpenAndAcknowledgedAlertsTool`, which returns the _details_ of alerts - In contrast to [elastic#173121](elastic#173121), this PR is focused on the alert counts _aggregation_ - This PR also updates the `range` of **both** the `AlertCountsTool` and the `OpenAndAcknowledgedAlertsTool` queries to standardize on the following syntax, which aligns with the `Last 24 hours` option in the _Commonly used_ section of the Kibana date picker: ```json "range": { "@timestamp": { "gte": "now-24h", "lte": "now" } } ``` To desk test this change: - The `assistantRagOnAlerts` feature flag described in [elastic#172542](elastic#172542) must be enabled, per the following example: ``` xpack.securitySolution.enableExperimental: ['assistantRagOnAlerts'] ``` - The `Alerts` feature must be enabled in the assistant settings, per the screenshot below:  1) Generate alerts with a variety of severity (e.g. `low`, `medium`, `high`, and `critical`) 2) After the alerts have been generated, disable all detection rules to keep the counts static during testing 3) Navigate to Security > Alerts 4) Select `Last 24 hours` from the _Commonly used_ section of the global date picker 5) Click the `Treemap` button to select the Treemap visualization 6) In the Treemap's `Group by` input, enter `kibana.alert.severity` 7) Next, in the Treemap's `Group by top` input, enter `kibana.alert.workflow_status` 8) Click the `AI Assistant` button to open the assistant 9) Click the `X` button to clear the conversation 10) Close the assistant 11) Add the following two fields as columns to the Alerts page table: ``` kibana.alert.workflow_status _id ``` 12) Sort the Alerts table, first by `kibana.alert.risk_score` from high to low, and then by `@timestamp` from new to old, per the screenshot below:  **Expected results** - The alerts page date range is `Last 24 hours` - The `Treemap` is selected - The treemap is grouped by `kibana.alert.severity` and then `kibana.alert.workflow_status` - The alerts table has custom sorting and columns, per the screenshot below:  13) Click the `AI Assistant` button to open the assistant 14) Ask the assistant: ``` How many open alerts do I have? ``` **Expected results** - The assistant will report on the counts and workflow status of alerts, per the example response and screenshot below: ``` You have a total of 47 open alerts. Here's the breakdown: 24 alerts with low severity, 12 alerts with medium severity, 7 alerts with high severity, and 4 alerts with critical severity. ```  15) Make note of the counts shown in the assistant, then close the assistant Expected result: - The counts from the assistant match the counts in the treemap legend, per the example screenshot below:  16) Change the workflow status of an alert in the Alerts table from `open` to `acknowledged` **Expected result** - The treemap and alerts table and include the updated (`acknowledged`) alert, per the screenshot below:  17) Once again, open the assistant 18) Once again, ask the (same) question: ``` How many open alerts do I have? ``` **Expected result** - The response from the assistant makes reference to the alert who's workflow status was changed from `open` to `acknowledged`, per the example response and screenshot below: ``` Based on the latest data I had received, you have a total of 47 open alerts. Here's the breakdown: 24 alerts are of low severity, 12 alerts are of medium severity, 7 alerts are of high severity, and 4 alerts are of critical severity (Note: One of the critical severity alerts has been acknowledged). ```  (cherry picked from commit 081f52b)
…ed` alerts in the LangChain `AlertCountsTool` aggregation (#173701) (#173801) # Backport This will backport the following commits from `main` to `8.12`: - [[Security Solution] [Elastic AI Assistant] Include `acknowledged` alerts in the LangChain `AlertCountsTool` aggregation (#173701)](#173701) <!--- Backport version: 8.9.8 --> ### Questions ? Please refer to the [Backport tool documentation](https://github.com/sqren/backport) <!--BACKPORT [{"author":{"name":"Andrew Macri","email":"andrew.macri@elastic.co"},"sourceCommit":{"committedDate":"2023-12-21T04:41:11Z","message":"[Security Solution] [Elastic AI Assistant] Include `acknowledged` alerts in the LangChain `AlertCountsTool` aggregation (#173701)\n\n## [Security Solution] [Elastic AI Assistant] Include `acknowledged` alerts in the LangChain `AlertCountsTool` aggregation\r\n\r\nThis PR updates the LangChain `AlertCountsTool` aggregation, which answers questions like `How many open alerts do I have?`, to include `acknowledged` alerts. The `AlertCountsTool` was introduced as part of [[Security Solution] [Elastic AI Assistant] Retrieval Augmented Generation (RAG) for Alerts #172542](https://github.com/elastic/kibana/pull/172542)\r\n\r\n- This PR is similar to <#173121>, where `acknowledged` alerts were added to the `OpenAndAcknowledgedAlertsTool`, which returns the _details_ of alerts\r\n - In contrast to [#173121](#173121), this PR is focused on the alert counts _aggregation_\r\n\r\n- This PR also updates the `range` of **both** the `AlertCountsTool` and the `OpenAndAcknowledgedAlertsTool` queries to standardize on the following syntax, which aligns with the `Last 24 hours` option in the _Commonly used_ section of the Kibana date picker:\r\n\r\n```json\r\n \"range\": {\r\n \"@timestamp\": {\r\n \"gte\": \"now-24h\",\r\n \"lte\": \"now\"\r\n }\r\n }\r\n```\r\n\r\n### Desk testing\r\n\r\nTo desk test this change:\r\n\r\n- The `assistantRagOnAlerts` feature flag described in [#172542](#172542) must be enabled, per the following example:\r\n\r\n```\r\nxpack.securitySolution.enableExperimental: ['assistantRagOnAlerts']\r\n```\r\n\r\n- The `Alerts` feature must be enabled in the assistant settings, per the screenshot below:\r\n\r\n \r\n\r\n1) Generate alerts with a variety of severity (e.g. `low`, `medium`, `high`, and `critical`)\r\n\r\n2) After the alerts have been generated, disable all detection rules to keep the counts static during testing\r\n\r\n3) Navigate to Security > Alerts\r\n\r\n4) Select `Last 24 hours` from the _Commonly used_ section of the global date picker\r\n\r\n5) Click the `Treemap` button to select the Treemap visualization\r\n\r\n6) In the Treemap's `Group by` input, enter `kibana.alert.severity`\r\n\r\n7) Next, in the Treemap's `Group by top` input, enter `kibana.alert.workflow_status`\r\n\r\n8) Click the `AI Assistant` button to open the assistant\r\n\r\n9) Click the `X` button to clear the conversation\r\n\r\n10) Close the assistant\r\n\r\n11) Add the following two fields as columns to the Alerts page table:\r\n\r\n```\r\nkibana.alert.workflow_status\r\n_id\r\n```\r\n\r\n12) Sort the Alerts table, first by `kibana.alert.risk_score` from high to low, and then by `@timestamp` from new to old, per the screenshot below:\r\n\r\n\r\n\r\n**Expected results**\r\n\r\n- The alerts page date range is `Last 24 hours`\r\n- The `Treemap` is selected\r\n- The treemap is grouped by `kibana.alert.severity` and then `kibana.alert.workflow_status`\r\n- The alerts table has custom sorting and columns, per the screenshot below:\r\n\r\n\r\n\r\n13) Click the `AI Assistant` button to open the assistant\r\n\r\n14) Ask the assistant:\r\n\r\n```\r\nHow many open alerts do I have?\r\n```\r\n\r\n**Expected results**\r\n\r\n- The assistant will report on the counts and workflow status of alerts, per the example response and screenshot below:\r\n\r\n```\r\nYou have a total of 47 open alerts. Here's the breakdown: 24 alerts with low severity, 12 alerts with medium severity, 7 alerts with high severity, and 4 alerts with critical severity.\r\n```\r\n\r\n\r\n\r\n15) Make note of the counts shown in the assistant, then close the assistant\r\n\r\nExpected result:\r\n\r\n- The counts from the assistant match the counts in the treemap legend, per the example screenshot below:\r\n\r\n\r\n\r\n16) Change the workflow status of an alert in the Alerts table from `open` to `acknowledged`\r\n\r\n**Expected result**\r\n\r\n- The treemap and alerts table and include the updated (`acknowledged`) alert, per the screenshot below:\r\n\r\n\r\n\r\n17) Once again, open the assistant\r\n\r\n18) Once again, ask the (same) question:\r\n\r\n```\r\nHow many open alerts do I have?\r\n```\r\n\r\n**Expected result**\r\n\r\n- The response from the assistant makes reference to the alert who's workflow status was changed from `open` to `acknowledged`, per the example response and screenshot below:\r\n\r\n```\r\nBased on the latest data I had received, you have a total of 47 open alerts. Here's the breakdown: 24 alerts are of low severity, 12 alerts are of medium severity, 7 alerts are of high severity, and 4 alerts are of critical severity (Note: One of the critical severity alerts has been acknowledged).\r\n```\r\n\r\n","sha":"081f52bfe3fbbaf5bb9476c656c308f7f9430df2","branchLabelMapping":{"^v8.13.0$":"main","^v(\\d+).(\\d+).\\d+$":"$1.$2"}},"sourcePullRequest":{"labels":["bug","release_note:skip","Team: SecuritySolution","Team:Threat Hunting:Investigations","Feature:Elastic AI Assistant","v8.12.0","v8.13.0"],"number":173701,"url":"https://github.com/elastic/kibana/pull/173701","mergeCommit":{"message":"[Security Solution] [Elastic AI Assistant] Include `acknowledged` alerts in the LangChain `AlertCountsTool` aggregation (#173701)\n\n## [Security Solution] [Elastic AI Assistant] Include `acknowledged` alerts in the LangChain `AlertCountsTool` aggregation\r\n\r\nThis PR updates the LangChain `AlertCountsTool` aggregation, which answers questions like `How many open alerts do I have?`, to include `acknowledged` alerts. The `AlertCountsTool` was introduced as part of [[Security Solution] [Elastic AI Assistant] Retrieval Augmented Generation (RAG) for Alerts #172542](https://github.com/elastic/kibana/pull/172542)\r\n\r\n- This PR is similar to <#173121>, where `acknowledged` alerts were added to the `OpenAndAcknowledgedAlertsTool`, which returns the _details_ of alerts\r\n - In contrast to [#173121](#173121), this PR is focused on the alert counts _aggregation_\r\n\r\n- This PR also updates the `range` of **both** the `AlertCountsTool` and the `OpenAndAcknowledgedAlertsTool` queries to standardize on the following syntax, which aligns with the `Last 24 hours` option in the _Commonly used_ section of the Kibana date picker:\r\n\r\n```json\r\n \"range\": {\r\n \"@timestamp\": {\r\n \"gte\": \"now-24h\",\r\n \"lte\": \"now\"\r\n }\r\n }\r\n```\r\n\r\n### Desk testing\r\n\r\nTo desk test this change:\r\n\r\n- The `assistantRagOnAlerts` feature flag described in [#172542](#172542) must be enabled, per the following example:\r\n\r\n```\r\nxpack.securitySolution.enableExperimental: ['assistantRagOnAlerts']\r\n```\r\n\r\n- The `Alerts` feature must be enabled in the assistant settings, per the screenshot below:\r\n\r\n \r\n\r\n1) Generate alerts with a variety of severity (e.g. `low`, `medium`, `high`, and `critical`)\r\n\r\n2) After the alerts have been generated, disable all detection rules to keep the counts static during testing\r\n\r\n3) Navigate to Security > Alerts\r\n\r\n4) Select `Last 24 hours` from the _Commonly used_ section of the global date picker\r\n\r\n5) Click the `Treemap` button to select the Treemap visualization\r\n\r\n6) In the Treemap's `Group by` input, enter `kibana.alert.severity`\r\n\r\n7) Next, in the Treemap's `Group by top` input, enter `kibana.alert.workflow_status`\r\n\r\n8) Click the `AI Assistant` button to open the assistant\r\n\r\n9) Click the `X` button to clear the conversation\r\n\r\n10) Close the assistant\r\n\r\n11) Add the following two fields as columns to the Alerts page table:\r\n\r\n```\r\nkibana.alert.workflow_status\r\n_id\r\n```\r\n\r\n12) Sort the Alerts table, first by `kibana.alert.risk_score` from high to low, and then by `@timestamp` from new to old, per the screenshot below:\r\n\r\n\r\n\r\n**Expected results**\r\n\r\n- The alerts page date range is `Last 24 hours`\r\n- The `Treemap` is selected\r\n- The treemap is grouped by `kibana.alert.severity` and then `kibana.alert.workflow_status`\r\n- The alerts table has custom sorting and columns, per the screenshot below:\r\n\r\n\r\n\r\n13) Click the `AI Assistant` button to open the assistant\r\n\r\n14) Ask the assistant:\r\n\r\n```\r\nHow many open alerts do I have?\r\n```\r\n\r\n**Expected results**\r\n\r\n- The assistant will report on the counts and workflow status of alerts, per the example response and screenshot below:\r\n\r\n```\r\nYou have a total of 47 open alerts. Here's the breakdown: 24 alerts with low severity, 12 alerts with medium severity, 7 alerts with high severity, and 4 alerts with critical severity.\r\n```\r\n\r\n\r\n\r\n15) Make note of the counts shown in the assistant, then close the assistant\r\n\r\nExpected result:\r\n\r\n- The counts from the assistant match the counts in the treemap legend, per the example screenshot below:\r\n\r\n\r\n\r\n16) Change the workflow status of an alert in the Alerts table from `open` to `acknowledged`\r\n\r\n**Expected result**\r\n\r\n- The treemap and alerts table and include the updated (`acknowledged`) alert, per the screenshot below:\r\n\r\n\r\n\r\n17) Once again, open the assistant\r\n\r\n18) Once again, ask the (same) question:\r\n\r\n```\r\nHow many open alerts do I have?\r\n```\r\n\r\n**Expected result**\r\n\r\n- The response from the assistant makes reference to the alert who's workflow status was changed from `open` to `acknowledged`, per the example response and screenshot below:\r\n\r\n```\r\nBased on the latest data I had received, you have a total of 47 open alerts. Here's the breakdown: 24 alerts are of low severity, 12 alerts are of medium severity, 7 alerts are of high severity, and 4 alerts are of critical severity (Note: One of the critical severity alerts has been acknowledged).\r\n```\r\n\r\n","sha":"081f52bfe3fbbaf5bb9476c656c308f7f9430df2"}},"sourceBranch":"main","suggestedTargetBranches":["8.12"],"targetPullRequestStates":[{"branch":"8.12","label":"v8.12.0","labelRegex":"^v(\\d+).(\\d+).\\d+$","isSourceBranch":false,"state":"NOT_CREATED"},{"branch":"main","label":"v8.13.0","labelRegex":"^v8.13.0$","isSourceBranch":true,"state":"MERGED","url":"https://github.com/elastic/kibana/pull/173701","number":173701,"mergeCommit":{"message":"[Security Solution] [Elastic AI Assistant] Include `acknowledged` alerts in the LangChain `AlertCountsTool` aggregation (#173701)\n\n## [Security Solution] [Elastic AI Assistant] Include `acknowledged` alerts in the LangChain `AlertCountsTool` aggregation\r\n\r\nThis PR updates the LangChain `AlertCountsTool` aggregation, which answers questions like `How many open alerts do I have?`, to include `acknowledged` alerts. The `AlertCountsTool` was introduced as part of [[Security Solution] [Elastic AI Assistant] Retrieval Augmented Generation (RAG) for Alerts #172542](https://github.com/elastic/kibana/pull/172542)\r\n\r\n- This PR is similar to <#173121>, where `acknowledged` alerts were added to the `OpenAndAcknowledgedAlertsTool`, which returns the _details_ of alerts\r\n - In contrast to [#173121](#173121), this PR is focused on the alert counts _aggregation_\r\n\r\n- This PR also updates the `range` of **both** the `AlertCountsTool` and the `OpenAndAcknowledgedAlertsTool` queries to standardize on the following syntax, which aligns with the `Last 24 hours` option in the _Commonly used_ section of the Kibana date picker:\r\n\r\n```json\r\n \"range\": {\r\n \"@timestamp\": {\r\n \"gte\": \"now-24h\",\r\n \"lte\": \"now\"\r\n }\r\n }\r\n```\r\n\r\n### Desk testing\r\n\r\nTo desk test this change:\r\n\r\n- The `assistantRagOnAlerts` feature flag described in [#172542](#172542) must be enabled, per the following example:\r\n\r\n```\r\nxpack.securitySolution.enableExperimental: ['assistantRagOnAlerts']\r\n```\r\n\r\n- The `Alerts` feature must be enabled in the assistant settings, per the screenshot below:\r\n\r\n \r\n\r\n1) Generate alerts with a variety of severity (e.g. `low`, `medium`, `high`, and `critical`)\r\n\r\n2) After the alerts have been generated, disable all detection rules to keep the counts static during testing\r\n\r\n3) Navigate to Security > Alerts\r\n\r\n4) Select `Last 24 hours` from the _Commonly used_ section of the global date picker\r\n\r\n5) Click the `Treemap` button to select the Treemap visualization\r\n\r\n6) In the Treemap's `Group by` input, enter `kibana.alert.severity`\r\n\r\n7) Next, in the Treemap's `Group by top` input, enter `kibana.alert.workflow_status`\r\n\r\n8) Click the `AI Assistant` button to open the assistant\r\n\r\n9) Click the `X` button to clear the conversation\r\n\r\n10) Close the assistant\r\n\r\n11) Add the following two fields as columns to the Alerts page table:\r\n\r\n```\r\nkibana.alert.workflow_status\r\n_id\r\n```\r\n\r\n12) Sort the Alerts table, first by `kibana.alert.risk_score` from high to low, and then by `@timestamp` from new to old, per the screenshot below:\r\n\r\n\r\n\r\n**Expected results**\r\n\r\n- The alerts page date range is `Last 24 hours`\r\n- The `Treemap` is selected\r\n- The treemap is grouped by `kibana.alert.severity` and then `kibana.alert.workflow_status`\r\n- The alerts table has custom sorting and columns, per the screenshot below:\r\n\r\n\r\n\r\n13) Click the `AI Assistant` button to open the assistant\r\n\r\n14) Ask the assistant:\r\n\r\n```\r\nHow many open alerts do I have?\r\n```\r\n\r\n**Expected results**\r\n\r\n- The assistant will report on the counts and workflow status of alerts, per the example response and screenshot below:\r\n\r\n```\r\nYou have a total of 47 open alerts. Here's the breakdown: 24 alerts with low severity, 12 alerts with medium severity, 7 alerts with high severity, and 4 alerts with critical severity.\r\n```\r\n\r\n\r\n\r\n15) Make note of the counts shown in the assistant, then close the assistant\r\n\r\nExpected result:\r\n\r\n- The counts from the assistant match the counts in the treemap legend, per the example screenshot below:\r\n\r\n\r\n\r\n16) Change the workflow status of an alert in the Alerts table from `open` to `acknowledged`\r\n\r\n**Expected result**\r\n\r\n- The treemap and alerts table and include the updated (`acknowledged`) alert, per the screenshot below:\r\n\r\n\r\n\r\n17) Once again, open the assistant\r\n\r\n18) Once again, ask the (same) question:\r\n\r\n```\r\nHow many open alerts do I have?\r\n```\r\n\r\n**Expected result**\r\n\r\n- The response from the assistant makes reference to the alert who's workflow status was changed from `open` to `acknowledged`, per the example response and screenshot below:\r\n\r\n```\r\nBased on the latest data I had received, you have a total of 47 open alerts. Here's the breakdown: 24 alerts are of low severity, 12 alerts are of medium severity, 7 alerts are of high severity, and 4 alerts are of critical severity (Note: One of the critical severity alerts has been acknowledged).\r\n```\r\n\r\n","sha":"081f52bfe3fbbaf5bb9476c656c308f7f9430df2"}}]}] BACKPORT-->
[Security Solution] [Elastic AI Assistant] Include
acknowledgedalerts in the LangChainAlertCountsToolaggregationThis PR updates the LangChain
AlertCountsToolaggregation, which answers questions likeHow many open alerts do I have?, to includeacknowledgedalerts. TheAlertCountsToolwas introduced as part of [Security Solution] [Elastic AI Assistant] Retrieval Augmented Generation (RAG) for Alerts #172542This PR is similar to [Security Solution] [Elastic AI Assistant] Include acknowledged alerts in the context sent to the LLM (Retrieval Augmented Generation (RAG) for Alerts) #173121, where
acknowledgedalerts were added to theOpenAndAcknowledgedAlertsTool, which returns the details of alertsThis PR also updates the
rangeof both theAlertCountsTooland theOpenAndAcknowledgedAlertsToolqueries to standardize on the following syntax, which aligns with theLast 24 hoursoption in the Commonly used section of the Kibana date picker:Desk testing
To desk test this change:
assistantRagOnAlertsfeature flag described in #172542 must be enabled, per the following example:Alertsfeature must be enabled in the assistant settings, per the screenshot below:Generate alerts with a variety of severity (e.g.
low,medium,high, andcritical)After the alerts have been generated, disable all detection rules to keep the counts static during testing
Navigate to Security > Alerts
Select
Last 24 hoursfrom the Commonly used section of the global date pickerClick the
Treemapbutton to select the Treemap visualizationIn the Treemap's
Group byinput, enterkibana.alert.severityNext, in the Treemap's
Group by topinput, enterkibana.alert.workflow_statusClick the
AI Assistantbutton to open the assistantClick the
Xbutton to clear the conversationClose the assistant
Add the following two fields as columns to the Alerts page table:
kibana.alert.risk_scorefrom high to low, and then by@timestampfrom new to old, per the screenshot below:Expected results
Last 24 hoursTreemapis selectedkibana.alert.severityand thenkibana.alert.workflow_statusClick the
AI Assistantbutton to open the assistantAsk the assistant:
Expected results
Expected result:
opentoacknowledgedExpected result
acknowledged) alert, per the screenshot below:Once again, open the assistant
Once again, ask the (same) question:
Expected result
opentoacknowledged, per the example response and screenshot below: