-
Notifications
You must be signed in to change notification settings - Fork 8.3k
New issue
Have a question about this project? Sign up for a free GitHub account to open an issue and contact its maintainers and the community.
By clicking “Sign up for GitHub”, you agree to our terms of service and privacy statement. We’ll occasionally send you account related emails.
Already on GitHub? Sign in to your account
[Security Solution] [AI Insights] AI Insights #180611
Conversation
|
lgtm from |
b714565 to
04816f9
Compare
Files by Code Ownerelastic/kibana-cloud-security-posture
elastic/security-defend-workflows
elastic/security-threat-hunting-explore
elastic/security-threat-hunting-investigations
|
There was a problem hiding this comment.
Choose a reason for hiding this comment
The reason will be displayed to describe this comment to others. Learn more.
Looks good from our team's standpoint 👍
...elastic-assistant-common/impl/schemas/insights/alerts/post_alerts_insights_route.schema.yaml
Outdated
Show resolved
Hide resolved
| [connectorId, generationIntervals] | ||
| ); | ||
|
|
||
| const pageTitle = useMemo(() => <PageTitle />, []); |
There was a problem hiding this comment.
Choose a reason for hiding this comment
The reason will be displayed to describe this comment to others. Learn more.
I don't think this needs useMemo
x-pack/packages/kbn-elastic-assistant/impl/assistant/chat_send/use_chat_send.tsx
Show resolved
Hide resolved
| }: { | ||
| anonymizationFields?: AnonymizationFieldResponse[]; | ||
| rawData?: string | Record<string, string[]>; | ||
| replacements?: Record<string, string>; |
There was a problem hiding this comment.
Choose a reason for hiding this comment
The reason will be displayed to describe this comment to others. Learn more.
Nit, we have a type in common attributes we could use for this and other instances of replacements
| replacements?: Record<string, string>; | |
| replacements?: Replacements; |
x-pack/plugins/elastic_assistant/server/routes/insights/alerts/helpers.ts
Outdated
Show resolved
Hide resolved
...i_insights/insight_markdown_formatter/field_markdown_renderer/get_user_flyout_panel_props.ts
Outdated
Show resolved
Hide resolved
0fd97b5 to
f2992dc
Compare
This comment was marked as resolved.
This comment was marked as resolved.
…d deployments ### Summary This PR enables LangSmith tracing for the [AI Insights](elastic#180611) feature in cloud deployments. LangSmith project names and API keys are specified using the same UI and patterns introduced by @spong in <elastic#180227> ### Details To enable LangSmith tracing in cloud deployments, configure the following `xpack.securitySolution.enableExperimental` feature flags: ``` xpack.securitySolution.enableExperimental: ['assistantModelEvaluation', 'assistantAlertsInsights'] ``` - The `assistantModelEvaluation` feature flag enables the `Evaluation` settings category in the assistant. The LangSmith project name and API key are configured here - The `assistantAlertsInsights` feature flag enables the AI Insights feature, which is off by default at the time of this writing After enabling the feature flags above: 1) Click the `AI Assistant` button anywhere in the Security Solution to launch the assistant 2) Click the settings gear in the assistant 3) Click the `Evaluation` settings category 4) Click `Show Trace Options (for internal use only)` 5) Specify a `LangSmith Project` and `LangSmith API Key` per the screenshot below: 
…eployments (#181159) ## [Security Solution] [AI Insights] Enable LangSmith tracing in cloud deployments ### Summary This PR enables LangSmith tracing for the [AI Insights](#180611) feature in cloud deployments. LangSmith project names and API keys are specified using the same UI and patterns introduced by @spong in <#180227> ### Details To enable LangSmith tracing in cloud deployments, configure the following `xpack.securitySolution.enableExperimental` feature flags: ``` xpack.securitySolution.enableExperimental: ['assistantModelEvaluation', 'assistantAlertsInsights'] ``` - The `assistantModelEvaluation` feature flag enables the `Evaluation` settings category in the assistant. The LangSmith project name and API key are configured here - The `assistantAlertsInsights` feature flag enables the AI Insights feature, which is off by default at the time of this writing After enabling the feature flags above: 1) Click the `AI Assistant` button anywhere in the Security Solution to launch the assistant 2) Click the settings gear in the assistant 3) Click the `Evaluation` settings category 4) Click `Show Trace Options (for internal use only)` 5) Specify a `LangSmith Project` and `LangSmith API Key` per the screenshot below: 
…eployments (elastic#181159) ## [Security Solution] [AI Insights] Enable LangSmith tracing in cloud deployments ### Summary This PR enables LangSmith tracing for the [AI Insights](elastic#180611) feature in cloud deployments. LangSmith project names and API keys are specified using the same UI and patterns introduced by @spong in <elastic#180227> ### Details To enable LangSmith tracing in cloud deployments, configure the following `xpack.securitySolution.enableExperimental` feature flags: ``` xpack.securitySolution.enableExperimental: ['assistantModelEvaluation', 'assistantAlertsInsights'] ``` - The `assistantModelEvaluation` feature flag enables the `Evaluation` settings category in the assistant. The LangSmith project name and API key are configured here - The `assistantAlertsInsights` feature flag enables the AI Insights feature, which is off by default at the time of this writing After enabling the feature flags above: 1) Click the `AI Assistant` button anywhere in the Security Solution to launch the assistant 2) Click the settings gear in the assistant 3) Click the `Evaluation` settings category 4) Click `Show Trace Options (for internal use only)` 5) Specify a `LangSmith Project` and `LangSmith API Key` per the screenshot below:  (cherry picked from commit 89609fe)
…cloud deployments (#181159) (#181203) # Backport This will backport the following commits from `main` to `8.14`: - [[Security Solution] [AI Insights] Enable LangSmith tracing in cloud deployments (#181159)](#181159) <!--- Backport version: 9.4.3 --> ### Questions ? Please refer to the [Backport tool documentation](https://github.com/sqren/backport) <!--BACKPORT [{"author":{"name":"Andrew Macri","email":"andrew.macri@elastic.co"},"sourceCommit":{"committedDate":"2024-04-18T19:01:27Z","message":"[Security Solution] [AI Insights] Enable LangSmith tracing in cloud deployments (#181159)\n\n## [Security Solution] [AI Insights] Enable LangSmith tracing in cloud deployments\r\n\r\n### Summary\r\n\r\nThis PR enables LangSmith tracing for the [AI Insights](#180611) feature in cloud deployments.\r\n\r\nLangSmith project names and API keys are specified using the same UI and patterns introduced by @spong in <https://github.com/elastic/kibana/pull/180227>\r\n\r\n### Details\r\n\r\nTo enable LangSmith tracing in cloud deployments, configure the following `xpack.securitySolution.enableExperimental` feature flags:\r\n\r\n```\r\nxpack.securitySolution.enableExperimental: ['assistantModelEvaluation', 'assistantAlertsInsights']\r\n```\r\n\r\n- The `assistantModelEvaluation` feature flag enables the `Evaluation` settings category in the assistant. The LangSmith project name and API key are configured here\r\n- The `assistantAlertsInsights` feature flag enables the AI Insights feature, which is off by default at the time of this writing\r\n\r\nAfter enabling the feature flags above:\r\n\r\n1) Click the `AI Assistant` button anywhere in the Security Solution to launch the assistant\r\n\r\n2) Click the settings gear in the assistant\r\n\r\n3) Click the `Evaluation` settings category\r\n\r\n4) Click `Show Trace Options (for internal use only)`\r\n\r\n5) Specify a `LangSmith Project` and `LangSmith API Key` per the screenshot below:\r\n\r\n","sha":"89609fe596d79b7d2eb4f209c5388824f9b279c1","branchLabelMapping":{"^v8.15.0$":"main","^v(\\d+).(\\d+).\\d+$":"$1.$2"}},"sourcePullRequest":{"labels":["release_note:skip","Team: SecuritySolution","Team:Security Generative AI","v8.14.0","v8.15.0","Feature:AI Insights"],"title":"[Security Solution] [AI Insights] Enable LangSmith tracing in cloud deployments","number":181159,"url":"https://github.com/elastic/kibana/pull/181159","mergeCommit":{"message":"[Security Solution] [AI Insights] Enable LangSmith tracing in cloud deployments (#181159)\n\n## [Security Solution] [AI Insights] Enable LangSmith tracing in cloud deployments\r\n\r\n### Summary\r\n\r\nThis PR enables LangSmith tracing for the [AI Insights](#180611) feature in cloud deployments.\r\n\r\nLangSmith project names and API keys are specified using the same UI and patterns introduced by @spong in <https://github.com/elastic/kibana/pull/180227>\r\n\r\n### Details\r\n\r\nTo enable LangSmith tracing in cloud deployments, configure the following `xpack.securitySolution.enableExperimental` feature flags:\r\n\r\n```\r\nxpack.securitySolution.enableExperimental: ['assistantModelEvaluation', 'assistantAlertsInsights']\r\n```\r\n\r\n- The `assistantModelEvaluation` feature flag enables the `Evaluation` settings category in the assistant. The LangSmith project name and API key are configured here\r\n- The `assistantAlertsInsights` feature flag enables the AI Insights feature, which is off by default at the time of this writing\r\n\r\nAfter enabling the feature flags above:\r\n\r\n1) Click the `AI Assistant` button anywhere in the Security Solution to launch the assistant\r\n\r\n2) Click the settings gear in the assistant\r\n\r\n3) Click the `Evaluation` settings category\r\n\r\n4) Click `Show Trace Options (for internal use only)`\r\n\r\n5) Specify a `LangSmith Project` and `LangSmith API Key` per the screenshot below:\r\n\r\n","sha":"89609fe596d79b7d2eb4f209c5388824f9b279c1"}},"sourceBranch":"main","suggestedTargetBranches":["8.14"],"targetPullRequestStates":[{"branch":"8.14","label":"v8.14.0","branchLabelMappingKey":"^v(\\d+).(\\d+).\\d+$","isSourceBranch":false,"state":"NOT_CREATED"},{"branch":"main","label":"v8.15.0","branchLabelMappingKey":"^v8.15.0$","isSourceBranch":true,"state":"MERGED","url":"https://github.com/elastic/kibana/pull/181159","number":181159,"mergeCommit":{"message":"[Security Solution] [AI Insights] Enable LangSmith tracing in cloud deployments (#181159)\n\n## [Security Solution] [AI Insights] Enable LangSmith tracing in cloud deployments\r\n\r\n### Summary\r\n\r\nThis PR enables LangSmith tracing for the [AI Insights](#180611) feature in cloud deployments.\r\n\r\nLangSmith project names and API keys are specified using the same UI and patterns introduced by @spong in <https://github.com/elastic/kibana/pull/180227>\r\n\r\n### Details\r\n\r\nTo enable LangSmith tracing in cloud deployments, configure the following `xpack.securitySolution.enableExperimental` feature flags:\r\n\r\n```\r\nxpack.securitySolution.enableExperimental: ['assistantModelEvaluation', 'assistantAlertsInsights']\r\n```\r\n\r\n- The `assistantModelEvaluation` feature flag enables the `Evaluation` settings category in the assistant. The LangSmith project name and API key are configured here\r\n- The `assistantAlertsInsights` feature flag enables the AI Insights feature, which is off by default at the time of this writing\r\n\r\nAfter enabling the feature flags above:\r\n\r\n1) Click the `AI Assistant` button anywhere in the Security Solution to launch the assistant\r\n\r\n2) Click the settings gear in the assistant\r\n\r\n3) Click the `Evaluation` settings category\r\n\r\n4) Click `Show Trace Options (for internal use only)`\r\n\r\n5) Specify a `LangSmith Project` and `LangSmith API Key` per the screenshot below:\r\n\r\n","sha":"89609fe596d79b7d2eb4f209c5388824f9b279c1"}}]}] BACKPORT--> Co-authored-by: Andrew Macri <andrew.macri@elastic.co>
… its original name, [AI Insights](elastic#180611).  _Above: Attack discovery in the Security Solution_ Attack discovery uses AI to identify active attacks in the environment, without the time (or prior experience) required to manually investigate individual alerts in Elastic Security, identify if they are related, and document the identified attack progression. While users can ask the Assistant to find these progressions today, Attack discovery is a dedicated UI to identify these progressions and action them accordingly. This feature adds a new page, `Attack discovery`, to the Security Solution's global navigation. Attack discoveries are generated from Large Language Models (LLMs) to identify attack progressions in alert data, and to correlate and identify related entities and events. When possible, attack progressions are attributed to threat actors. Users may generate attack discoveries from a variety of LLMs, configured via [Connectors](https://www.elastic.co/guide/en/kibana/master/action-types.html):  _Above: LLM selection via the connectors popup menu_ Clicking on the title of an attack discovery toggles the discovery between the collapsed and expanded state:  _Above: Collapsing / expanding an attack discovery (animated gif)_ The first three discoveries displayed on the Attack discoveries page are expanded by default. Any additional discoveries that appear after the first three must be expanded manually. Attack discoveries provide a summary of the entities impacted by an attack. Clicking on an entity, i.e. a hostname or username, displays the entity flyout with the entity's risk summary:  _Above: Clicking on a host in the summary of the attack discovery reveals the host risk summary (animated gif)_ Hover over fields in the discovery's summary or details to reveal pivot actions for investigations:  _Above: Hovering over fields in the details of an attack discovery reveals pivot actions (animated gif)_ Attack discoveries are generated from alerts provided as context to the selected LLM. The alert data provided to the LLM is anonymized automatically. Anonymization is [configured](https://www.elastic.co/guide/en/security/current/security-assistant.html#ai-assistant-anonymization) via the same anonymization settings as the Assistant. Users may override the defaults to allow or deny specific alert fields, and to toggle anonymization on or off for specific fields. Click the Anonymization toggle to show or hide the actual values sent to the LLM:  _Above: Toggling anonymization to reveal the actual values sent to the LLM (animated gif)_ At the start of a session, or when a user selects a connector that doesn't (yet) have any attack discoveries, an [empty prompt](https://eui.elastic.co/#/display/empty-prompt) is displayed. The animated counter in the empty prompt counts up until it displays the maximum number of alerts that will be sent to the LLM: 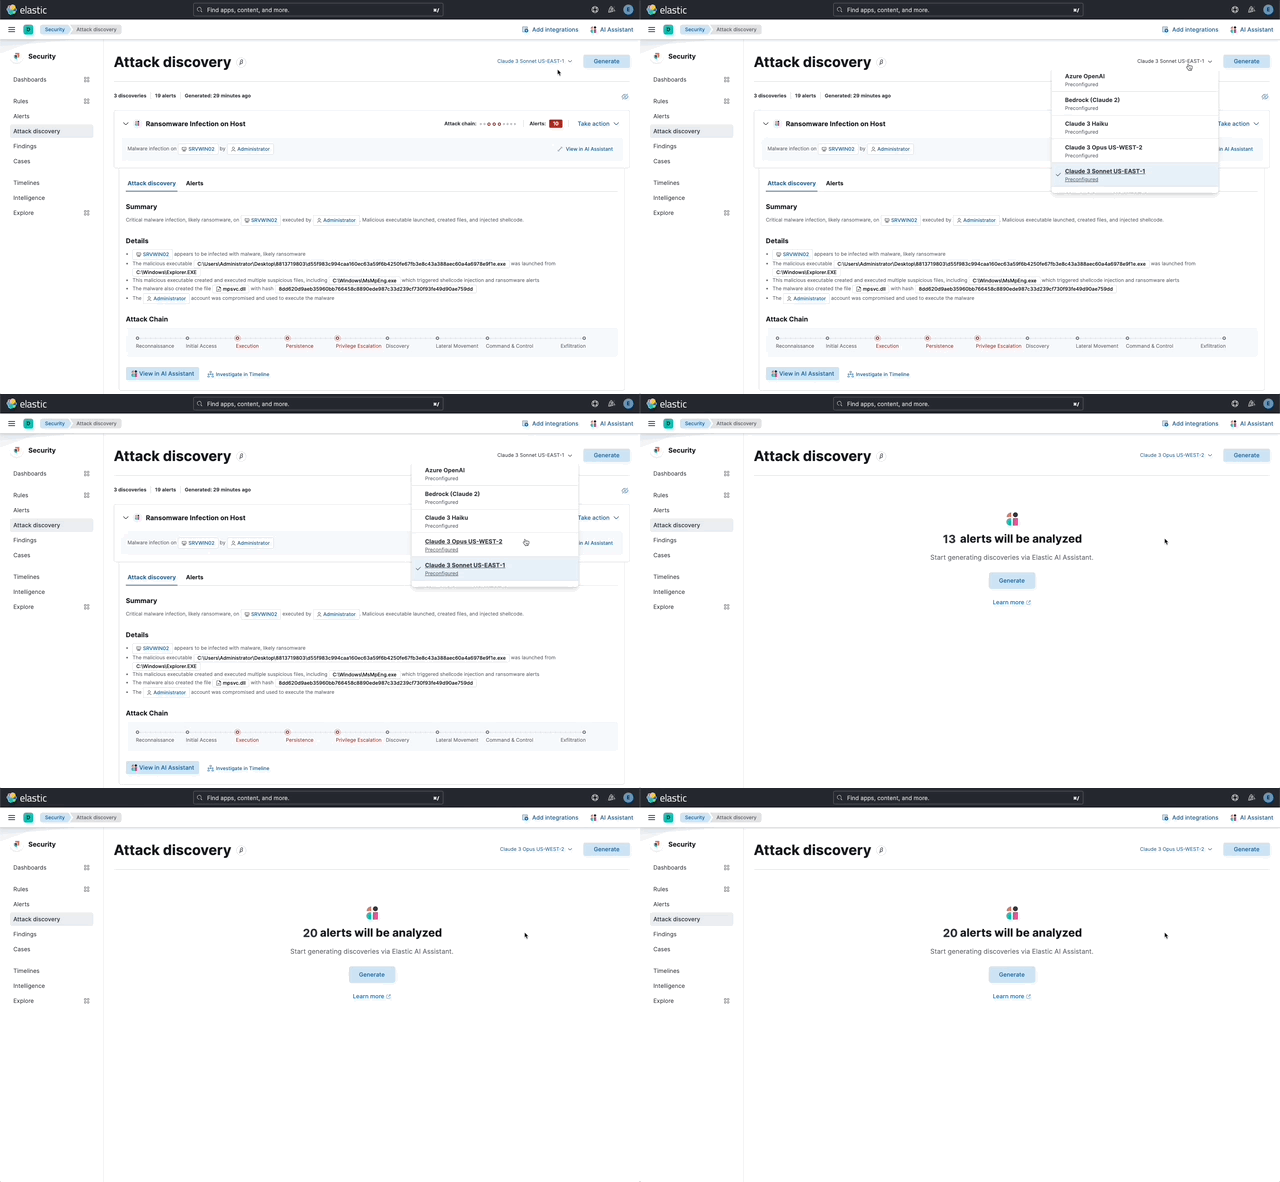 _Above: An animated counter displays the maximum number of alerts that will be sent to the LLM (animiated gif)_ The _Settings_ section of this PR details how users configure the number of alerts sent to the LLM. The animated counter in the empty prompt immediately re-animates to the newly-selected number when the setting is updated. The _Take action_ popover displays the following actions: - `Add to new case` - `Add to existing case` - `View in AI Assistant` 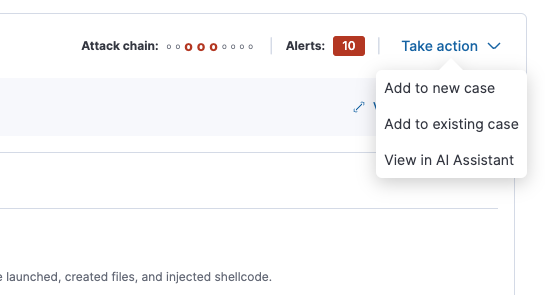 _Above: The Take action popover_ Clicking the `Add to new` case action displays the `Create case` flyout.  _Above: The `Add to new case` workflow_ An `Alerts were added to <case name>` toast is displayed when the case is created:  _Above: Case creation toast_ A markdown representation of the attack discovery is added to the case:  _Above: A markdown representation of an attack discovery in a case_ The alerts correlated to generate the discovery are attached to the case:  _Above: Attack discovery alerts attached to a case_ Clicking the `Add to existing case` action displays the `Select case` popover. 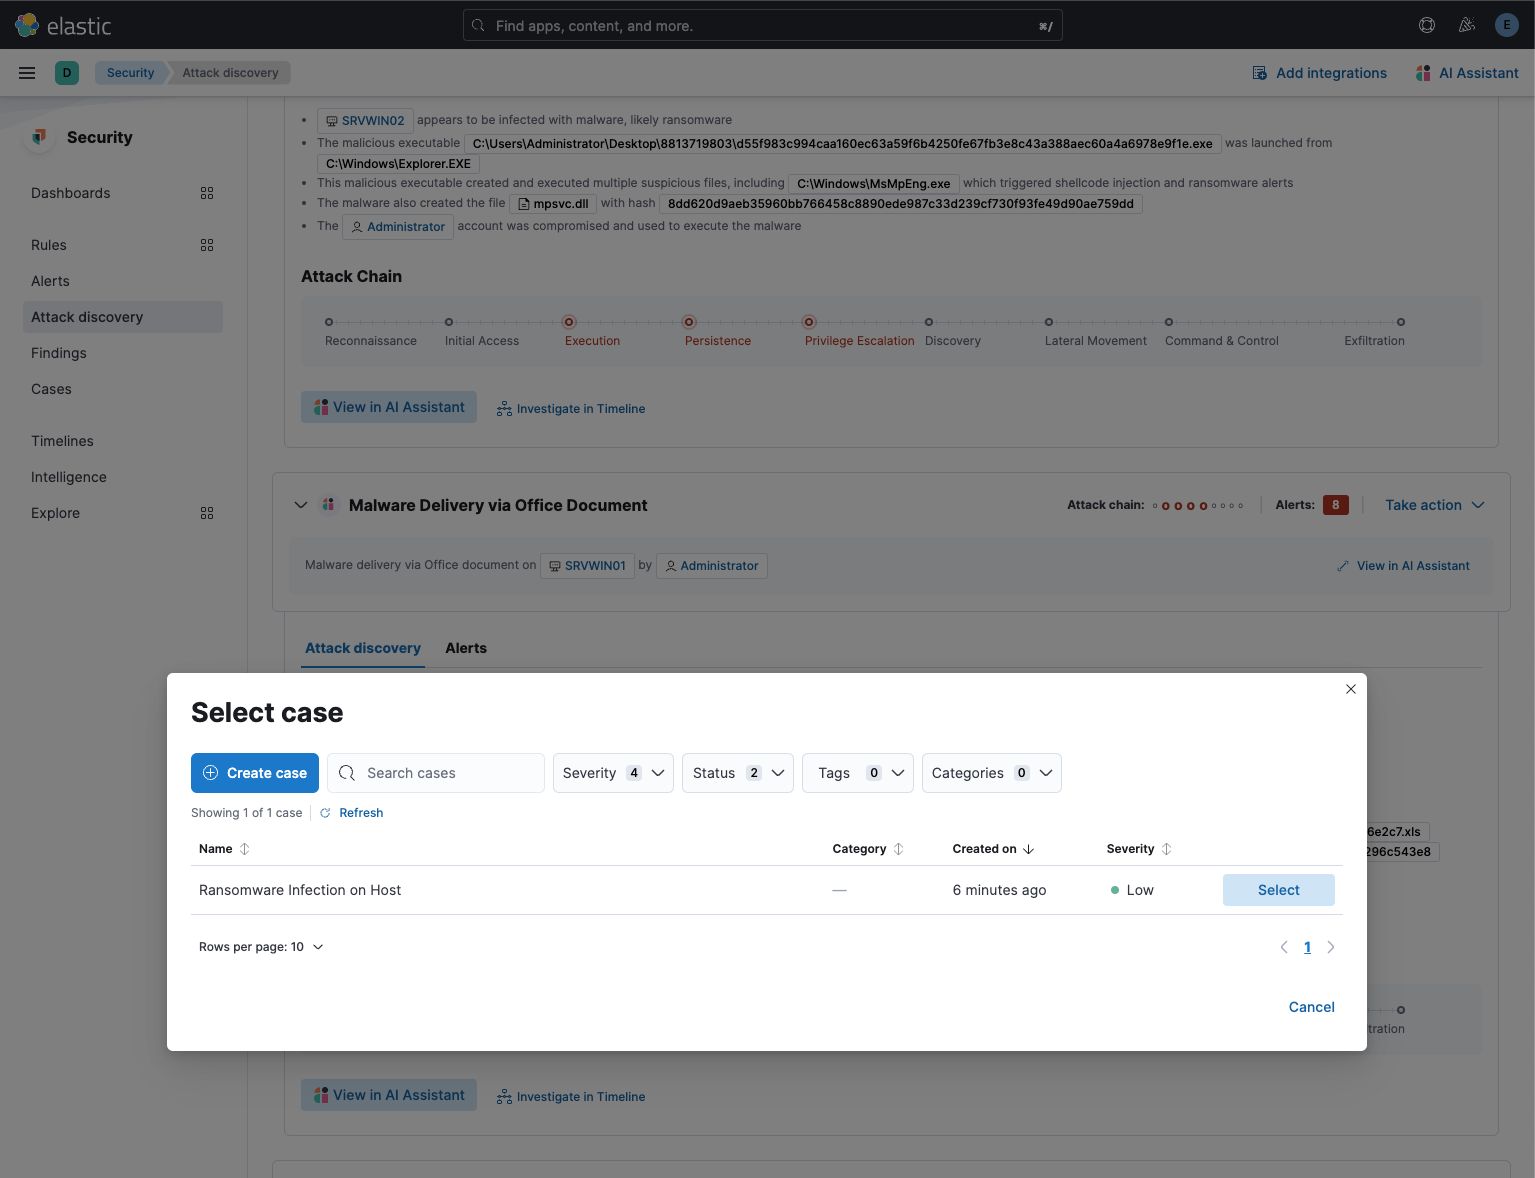 _Above: The `Select case` popover_ When users select an existing case, a markdown representation of the attack discovery, and the alerts correlated to generate the discovery are attached to the case, as described above in the _Add to new case_ section. The `View in AI Assistant` action in the `Take action` popover, and two additional `View in AI Assistant` affordances that appear in each discovery have the same behavior: Clicking `View in AI Assistant` opens the assistant and adds the attack discovery as context to the current conversation. 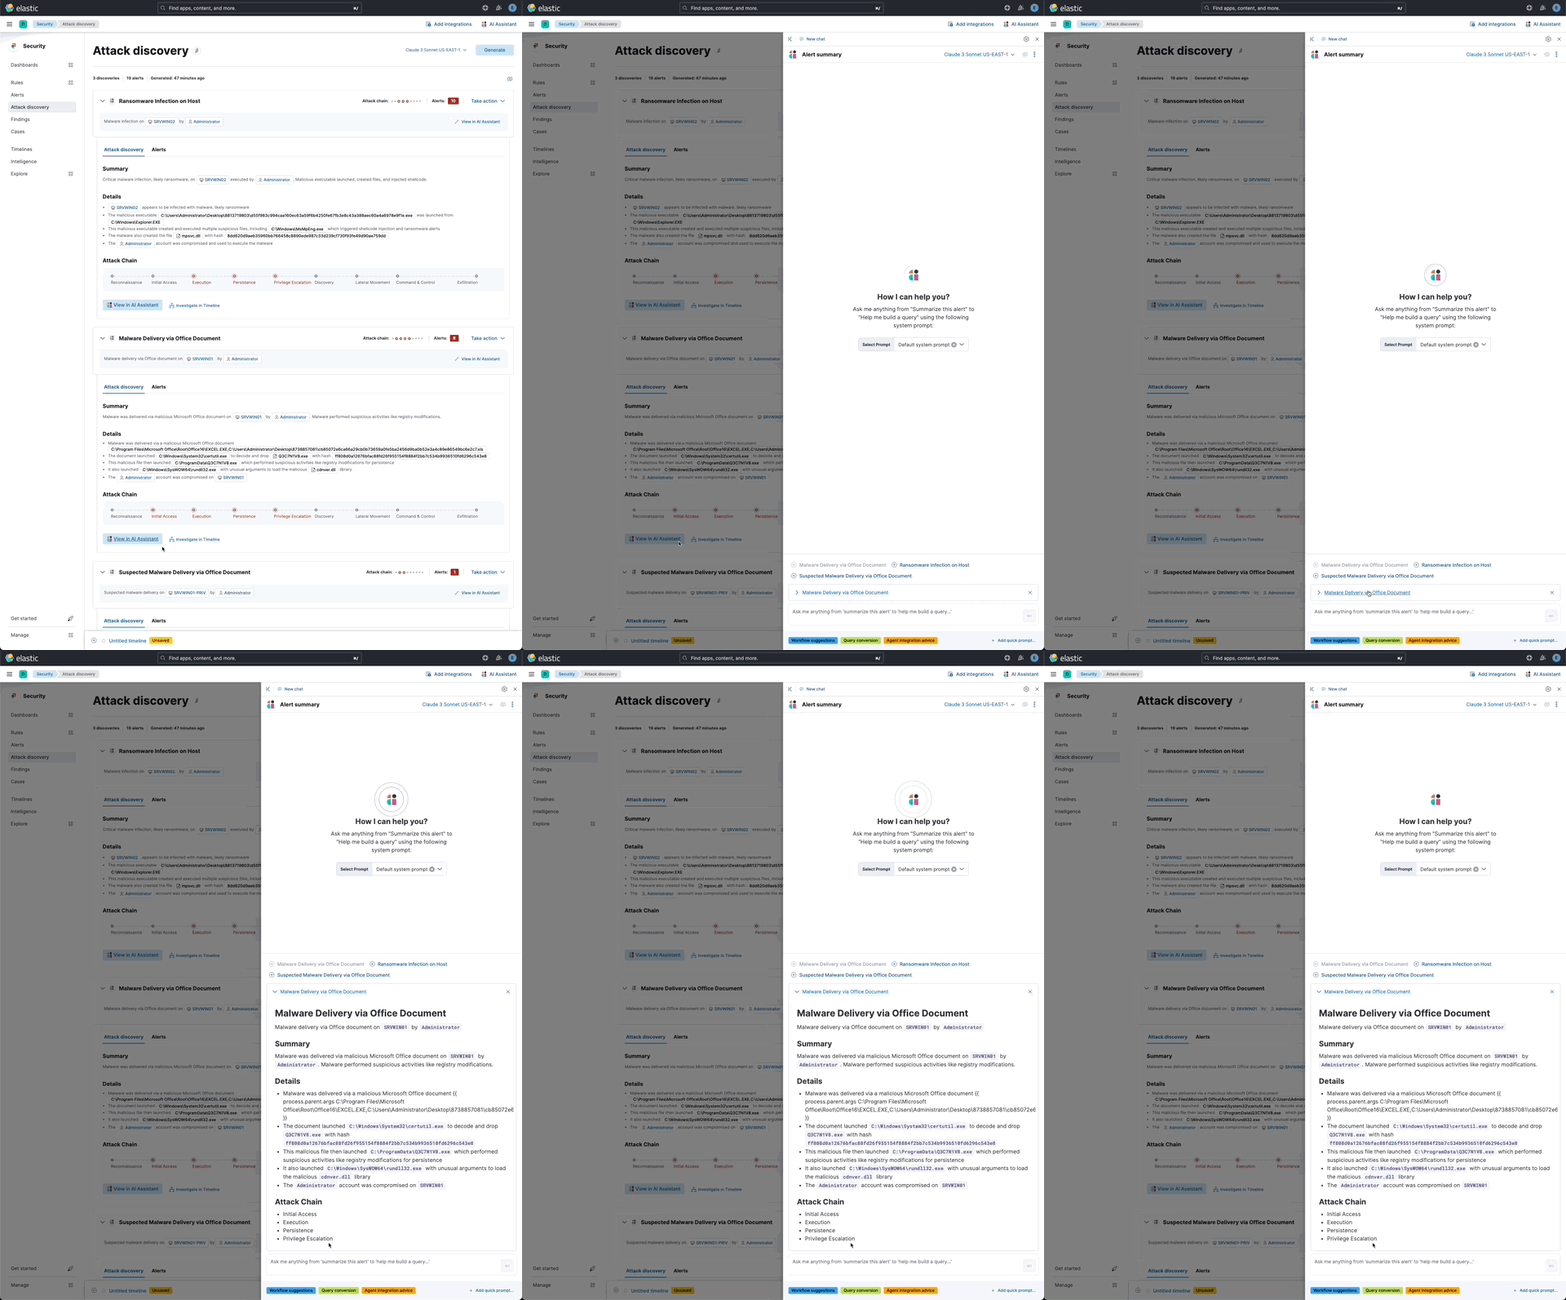 _Above: An attack discovery added as context to the current conversation_ Clicking on the attack discovery in the assistant expands it to reveal a preview of the discovery.  _Above: An expanded attack discovery preview in the assistant_ The expanded attack discovery preview reveals the number of anonymzied fields from the discovery that were made available to the conversation. This feature ensures discoveries are added to a conversation with the anonymized field values. An attack discovery viewed in the AI assistant doesn't become part of the conversation until the user submits it by asking a question, e.g. `How do I remediate this?`. Attack discoveries provided as context to a conversation are formatted as markdown when sent to the LLM:  _Above: Attack discoveries provided as context to a conversation are formatted as markdown_ Users may toggle anonymization in the conversation to reveal the original field values. 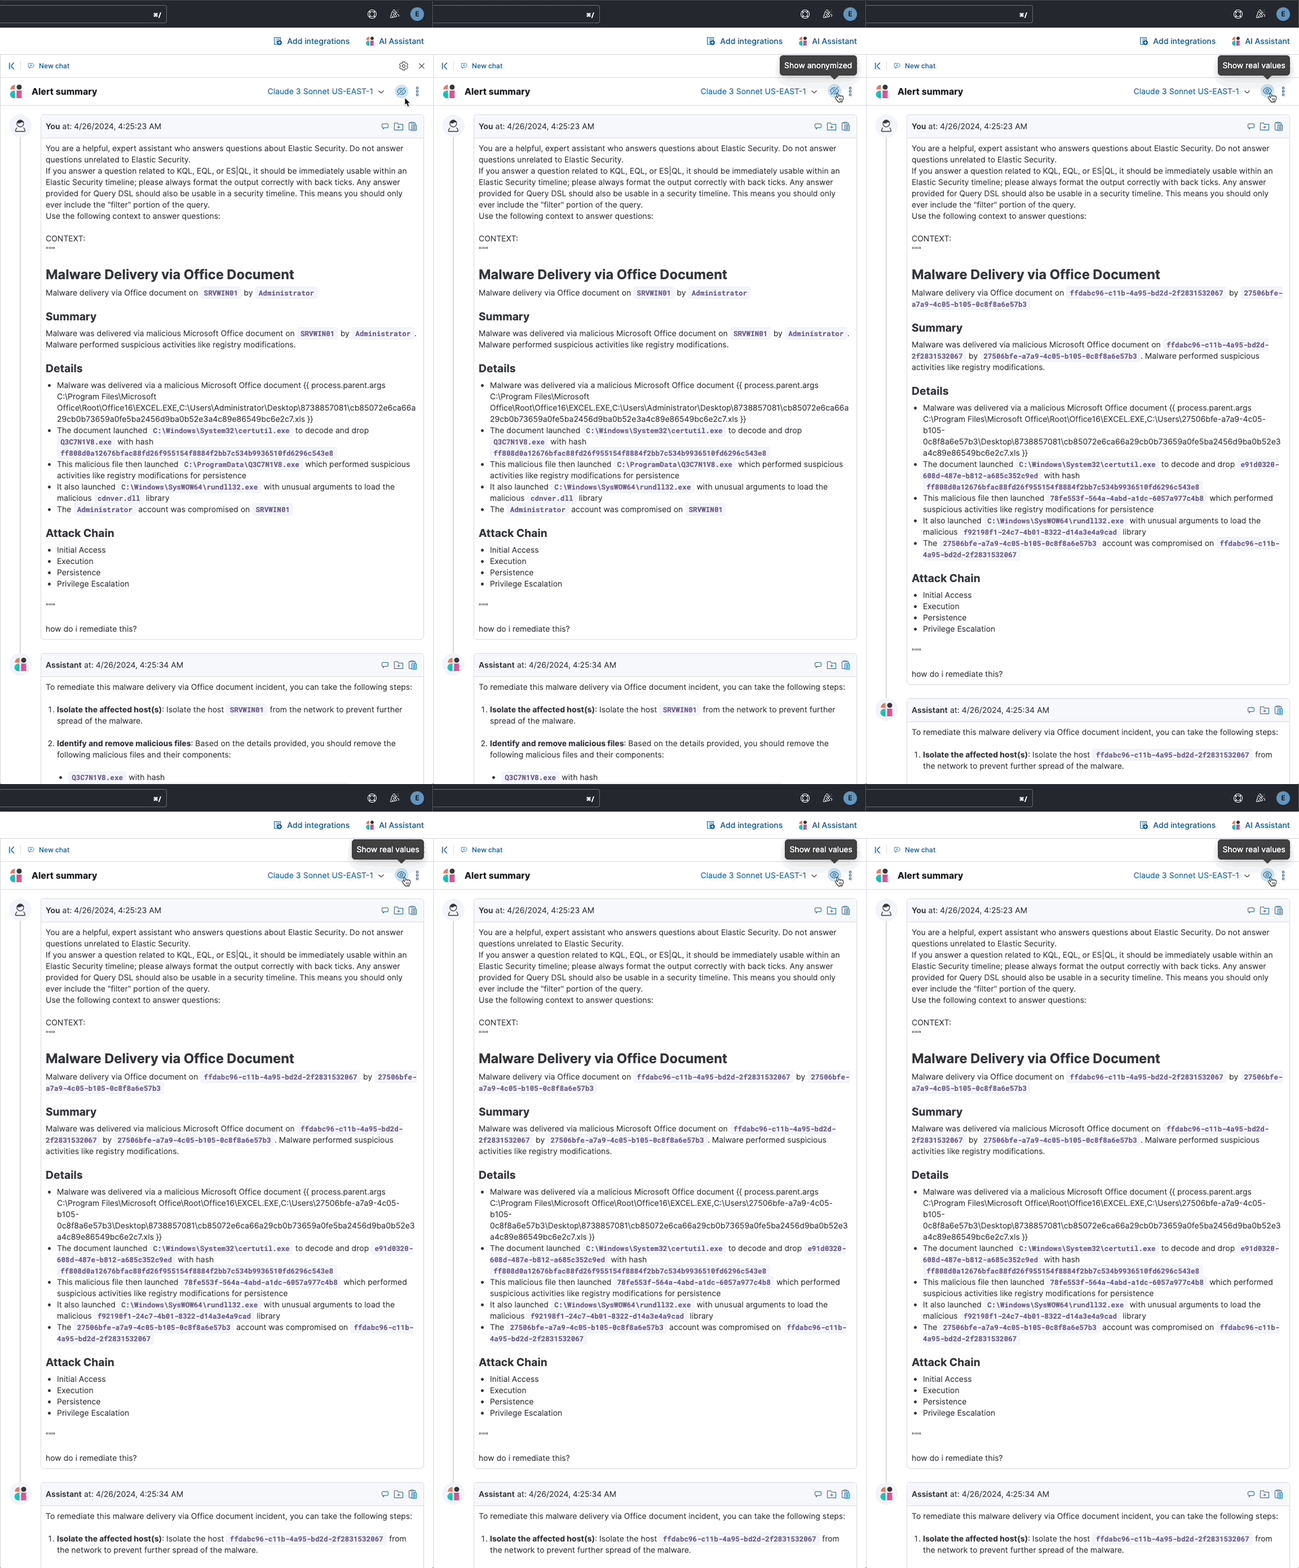 _Above: Revealing the original field values of an attack discovery added as markdown to a conversation (animated gif)_ The _Alerts_ tab displays the alerts correlated to generate the discovery. 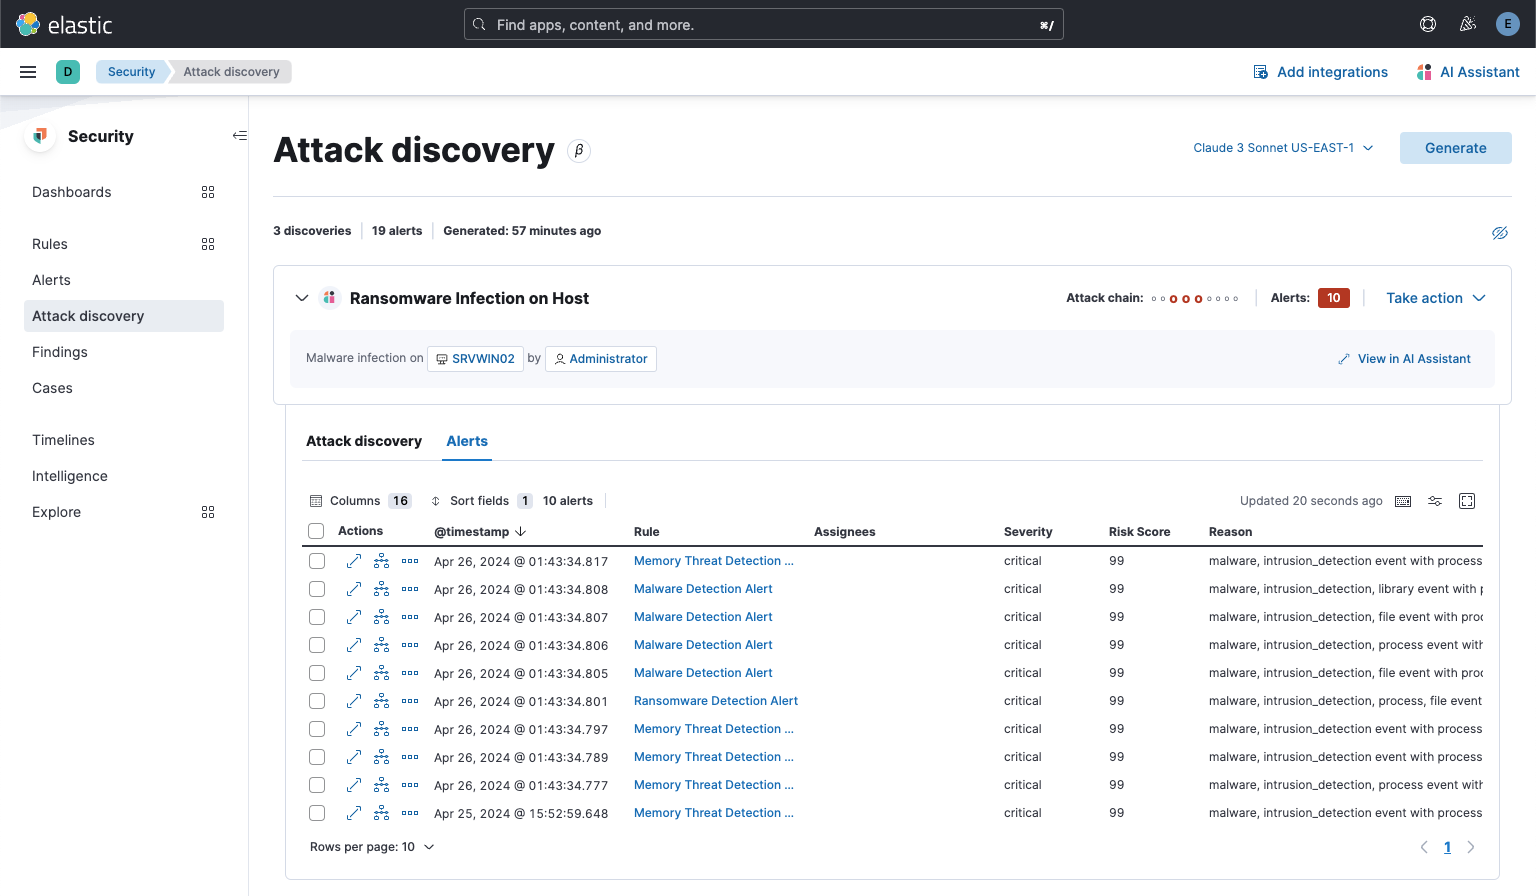 _Above: The alerts correlated to generate the attack discovery in the Alerts tab_ The `View details`, `Investigate in timeline`, and overflow row-level alert actions displayed in the Alerts tab are the same actions available on the Cases's page's Alerts tab:  _Above: Row-level actions are the same as the Cases pages Alert's tab_ Click an attack discovery's `Investigate in Timeline` button to begin an investigation of an discovery's alerts in Timeline. Alert IDs are queried via the `Alert Ids` filter:  _Above: Clicking Investigate in Timeline (animated gif)_ The alerts from the attack discovery are explained via row renderers in Timeline:  _Above: Row rendered attack discovery alerts in Timeline_ When alerts are indicative of attack [tactics](https://attack.mitre.org/tactics/enterprise/), those tactics are displayed in the discovery's _Attack Chain_ section:  _Above: An attack discovery with tactics in the Attack chain_ The Attack Chain section will be hidden if an attack discovery is not indicative of specific tactics. Every attack discovery includes a mini attack chain that visually summarizes the tactics in a discovery. Hovering over the mini attack chain reveals a tooltip with the details: 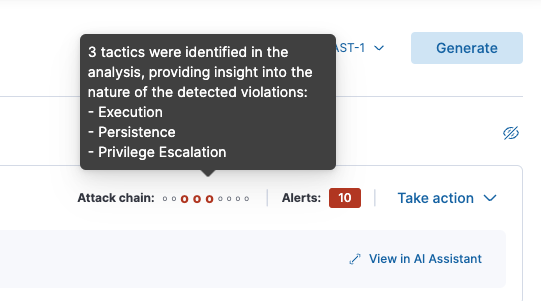 _Above: The mini attack chain tooltip_ The latest attack discoveries generated for each connector are cached in the browser's session storage in the following key: ``` elasticAssistantDefault.attackDiscovery.default.cachedAttackDiscoveries ``` Caching attack discoveries in session storage makes it possible to immediately display the latest when users return to the Attack discoveries page from other pages in the security solution (e.g. Cases). 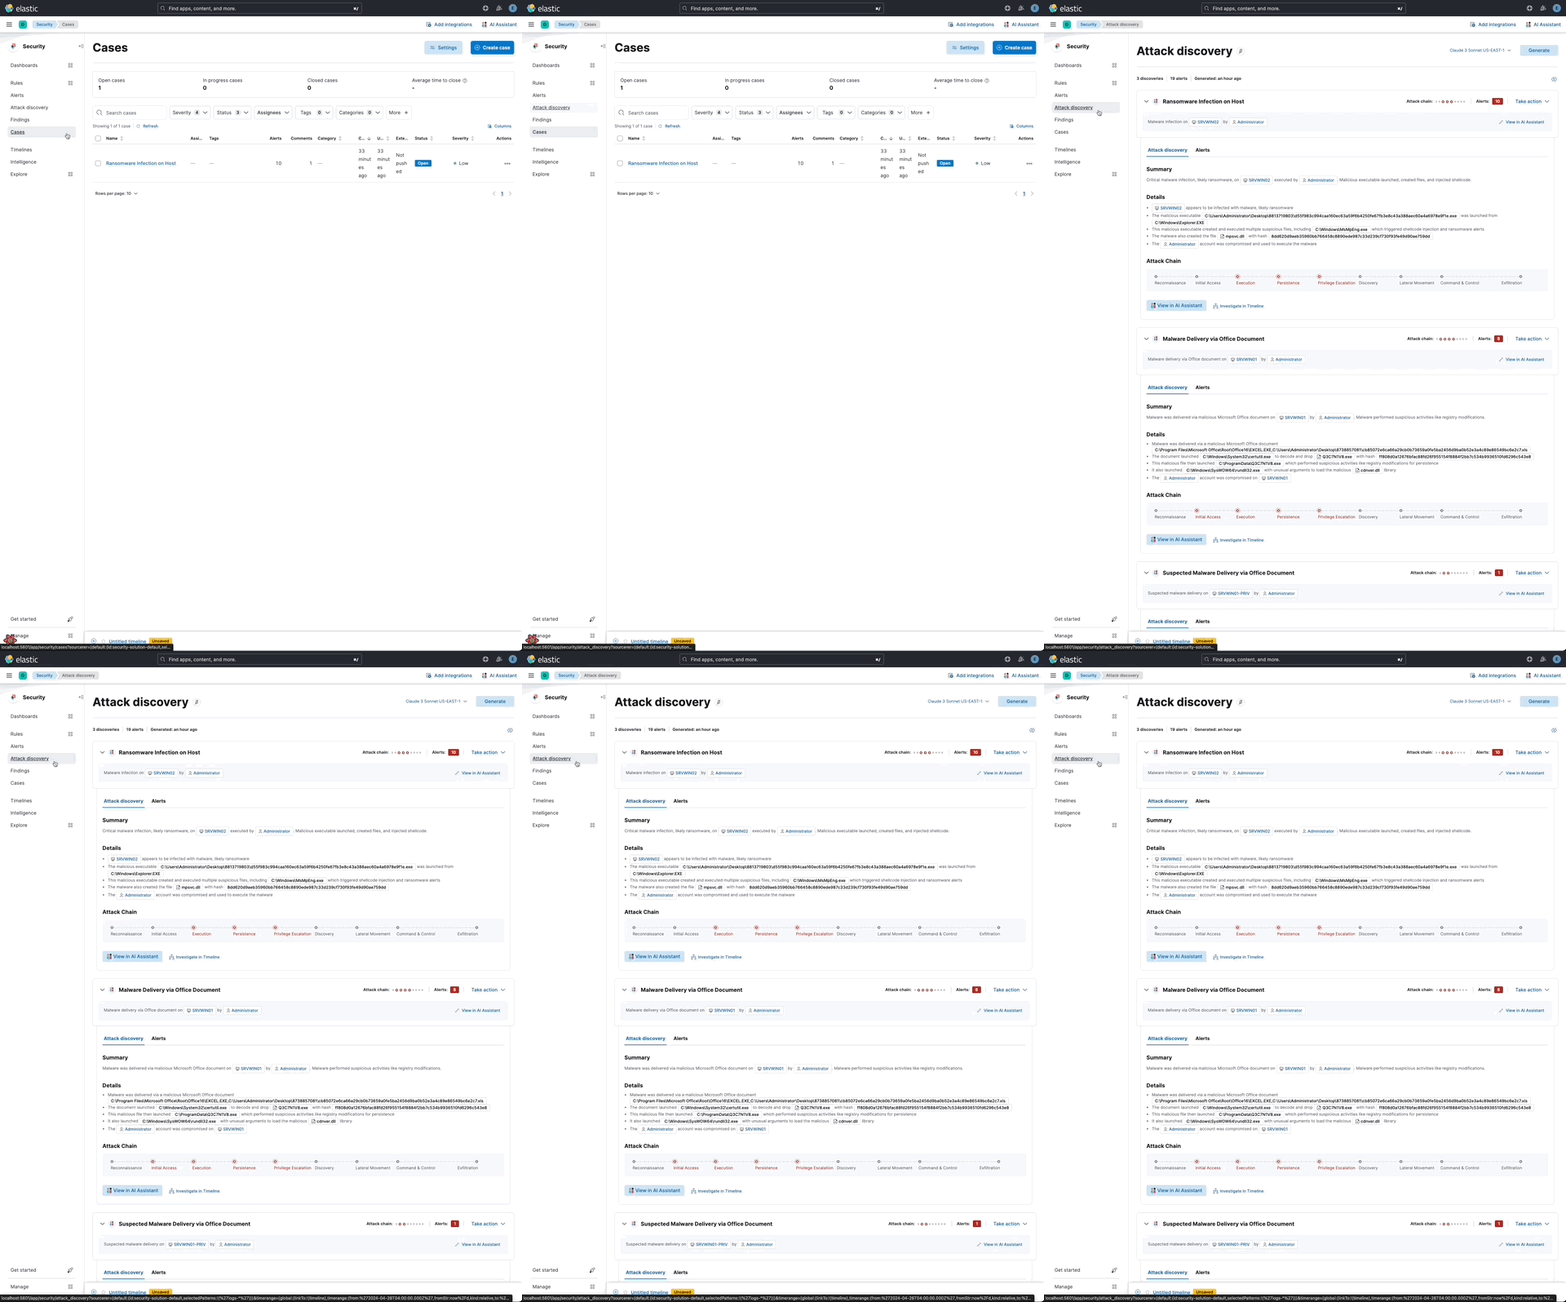 _Above: Cached attack discoveries from session storage are immediately displayed when users navigate back to Attack discoveries (animated gif)_ While waiting for a connector to generate results, users may view the cached results from other connectors. Cached attack discoveries are immediately available, even after a full page refresh, as long as the browser session is still active. Some LLMs may take seconds, or even minutes to generate attack discoveries. To help users anticipate the time it might take to generate new discoveries, the page displays a `Approximate time remaining: mm:ss` countdown timer that counts down to zero from the average time it takes to generate discoveries for the selected LLM:  _Above: The `Approximate time remaining: mm:ss` countdown counter (animated gif)_ If the LLM doesn't generate attack discoveries before the counter reaches zero, the text will change from `Approximate time remaining: mm:ss` to `Above average time: mm:ss`, and start counting up from `00:00` until the attack discoveries are generated: 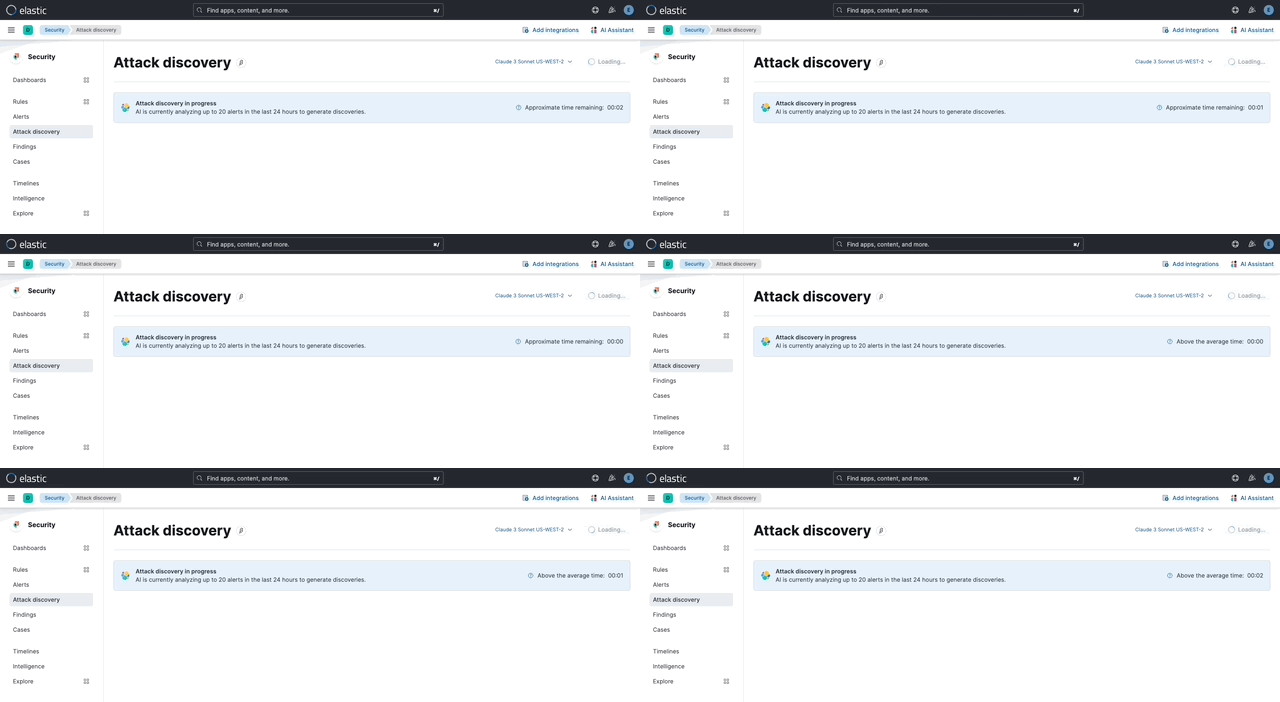 _Above: The `Above average time: mm:ss` counter (animated gif)_ The first time attack discoveries are generated for a model, the `Approximate time remaining: mm:ss` counter is not displayed. Average time is calculated over the last 5 generations on the selected connector. This is illustrated by clicking on the (?) information icon next to the timer. The popover displays the average time, and the time in seconds for the last 5 runs:  _Above: Clicking on the (?) information icon displays the average time, and the duration / datetimes for the last 5 generations_ The time and duration of the last 5 generations (for each connector) are persisted in the browser's local storage in the following key: ``` elasticAssistantDefault.attackDiscovery.default.generationIntervals ``` When attack discovery generation fails, an error toaster is displayed to explain the failure:  _Above: An error toast explains why attack discovery generation failed_ The `attackDiscoveryEnabled` feature flag must be enabled to view the `Attack discovery` link in the Security Solution's global navigation. Add the `attackDiscoveryEnabled` feature flag to the `xpack.securitySolution.enableExperimental` setting in `config/kibana.yml` (or `config/kibana.dev.yml` in local development environments), per the example below: ``` xpack.securitySolution.enableExperimental: ['attackDiscoveryEnabled'] ``` The number of alerts sent as context to the LLM is configured by `Knowledge Base` > `Alerts` slider in the screenshot below: 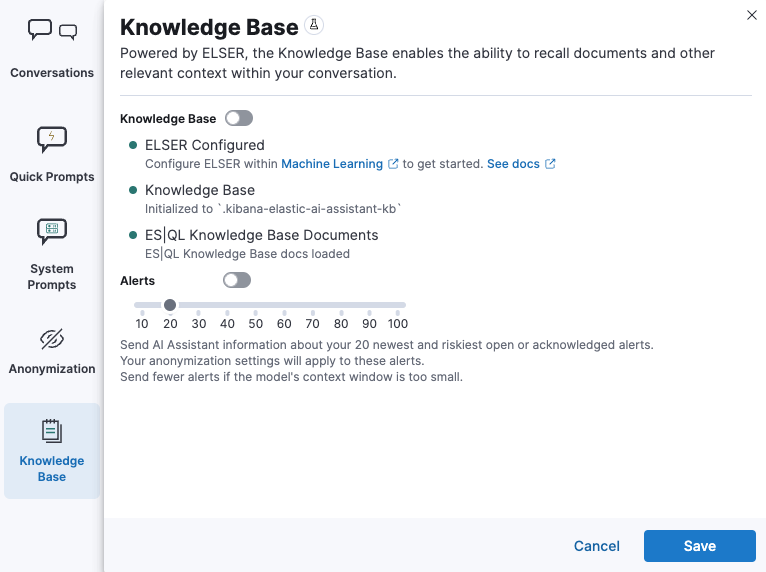 - The slider has a range of `10` - `100` alerts (default: `20`) Up to `n` alerts (as determined by the slider) that meet the following criteria will be returned: - The `kibana.alert.workflow_status` must be `open` - The alert must have been generated in the last `24 hours` - The alert must NOT be a `kibana.alert.building_block_type` alert - The `n` alerts are ordered by `kibana.alert.risk_score`, to prioritize the riskiest alerts An Enterprise license is required to use Attack discovery. The following empty view is displayed for users who don't have an Enterprise license:  - Users navigate to the Attack discovery page: `x-pack/plugins/security_solution/public/attack_discovery/pages/index.tsx` - When users click the `Generate` button(s) on the Attack discovery page, attack discoveries are fetched via the `useAttackDiscovery` hook in `x-pack/plugins/security_solution/public/attack_discovery/use_attack_discovery/index.tsx`. - The `fetchAttackDiscoveries` function makes an http `POST` request is made to the `/internal/elastic_assistant/attack_discovery` route. Requests include the following parameters: - `actionTypeId`, determines temperature and other connector-specific request parameters - `alertsIndexPattern`, the alerts index for the current Kibana Space, e.g. `.alerts-security.alerts-default` - `anonymizationFields`, the user's `Allowed` and (when applicable `Anonymized` ) fields in the `Anonymization` settings, e.g. `["@timestamp", "cloud.availability_zone", "file.name", "user.name", ...]` - `connectorId`, id of the connector to generate the attack discoveries - `size`, the maximum number of alerts to generate attack discoveries from. This numeric value is set by the slider in the user's `Knowledge Base > Alerts` setting, e.g. `20` - `replacements`, an optional `Record<string, string>` collection of replacements that's always empty in the current implementation. When non-empty, this collection enables new attack discoveries to be generated using existing replacements. ```json "replacements": { "e4f935c0-5a80-47b2-ac7f-816610790364": "Host-itk8qh4tjm", "cf61f946-d643-4b15-899f-6ffe3fd36097": "rpwmjvuuia", "7f80b092-fb1a-48a2-a634-3abc61b32157": "6astve9g6s", "f979c0d5-db1b-4506-b425-500821d00813": "Host-odqbow6tmc", // ... }, ``` - The `postAttackDiscoveryRoute` function in `x-pack/plugins/elastic_assistant/server/routes/attack_discovery/post_attack_discovery.ts` handles the request. - The inputs and outputs to/from this route are defined by the [OpenAPI](https://spec.openapis.org/oas/v3.1.0) schema in `x-pack/packages/kbn-elastic-assistant-common/impl/schemas/attack_discovery/post_attack_discovery_route.schema.yaml`. ``` node scripts/generate_openapi --rootDir ./x-pack/packages/kbn-elastic-assistant-common ``` - The `postAttackDiscoveryRoute` route handler function in `x-pack/plugins/elastic_assistant/server/routes/attack_discovery/post_attack_discovery.ts` invokes the `attack-discovery` tool, defined in `x-pack/plugins/security_solution/server/assistant/tools/attack_discovery/attack_discovery_tool.ts`. The `attack-discovery` tool is registered by the Security Solution. Note: The `attack-discovery` tool is only used by the attack discovery page. It is not used to generate new attack discoveries from the context of an assistant conversation, but that feature could be enabled in a future release. - The `attack-discovery` tool uses a LangChain `OutputFixingParser` to create a [prompt sandwich](https://www.elastic.co/blog/crafting-prompt-sandwiches-generative-ai) with the following parts: ``` ______________________________________________________ / \ | Attack discovery JSON formatting instructions | (1) \ _____________________________________________________/ +-----------------------------------------------------+ | Attack discovery prompt | (2) +-----------------------------------------------------+ / \ | Anonymized Alerts | (3) \_____________________________________________________/ ``` - The `Attack discovery JSON formatting instructions` in section `(1)` of the prompt sandwich are defined in the `getOutputParser()` function in `x-pack/plugins/security_solution/server/assistant/tools/attack_discovery/get_output_parser.ts`. This function creates a LangChain `StructuredOutputParser` from a Zod schema. This parser validates responses from the LLM to ensure they are formatted as JSON representing an attack discovery. - The `Attack discovery prompt` in section `(2)` of the prompt sandwich is defined in the `getAttackDiscoveryPrompt()` function in `x-pack/plugins/security_solution/server/assistant/tools/attack_discovery/get_attack_discovery_prompt.ts`. This part of the prompt sandwich includes instructions for correlating alerts, and additional instructions to the LLM for formatting JSON. - The `Anonymized Alerts` in section `(3)` of the prompt sandwich are returned by the `getAnonymizedAlerts()` function in `x-pack/plugins/security_solution/server/assistant/tools/attack_discovery/get_anonymized_alerts.ts`. The allow lists configured by the user determine which alert fields will be included and anonymized. - The `postAttackDiscoveryRoute` route handler returns the attack discoveries generated by the `attack-discovery` tool to the client (browser). - Attack discoveries are rendered in the browser via the `AttackDiscoveryPanel` component in `x-pack/plugins/security_solution/public/attack_discovery/attack_discovery_panel/index.tsx` - The `AttackDiscoveryTab` tab in `x-pack/plugins/security_solution/public/attack_discovery/attack_discovery_panel/tabs/attack_discovery_tab/index.tsx` includes the _Summary_ and _Details_ section of the attack discovery. - The `AttackDiscoveryMarkdownFormatter` in `x-pack/plugins/security_solution/public/attack_discovery/attack_discovery_markdown_formatter/index.tsx` renders hover actions on entities (like hostnames and usernames) and other fields in the attack discovery. - The `AttackDiscoveryPanel` component makes use of the `useAssistantOverlay` hook in `x-pack/packages/kbn-elastic-assistant/impl/assistant/use_assistant_overlay/index.tsx` to register the attack discovery as context with the assistant. This registration process makes it possible to view discoveries in the assistant, and ask questions like "How do I remediate this?". In this feature, the `useAssistantOverlay` hook was enhanced to accept anonymizaton replacements. This enables an assistant conversation to (re)use replacements originally generated for an attack discovery.
## [Security Solution] [Attack discovery] Attack discovery ### Summary This PR renames the _Attack discovery_ Security Solution feature from its original name, [AI Insights](#180611).  _Above: Attack discovery in the Security Solution_ Attack discovery uses AI to identify active attacks in the environment, without the time (or prior experience) required to manually investigate individual alerts in Elastic Security, identify if they are related, and document the identified attack progression. While users can ask the Assistant to find these progressions today, Attack discovery is a dedicated UI to identify these progressions and action them accordingly. This feature adds a new page, `Attack discovery`, to the Security Solution's global navigation. Attack discoveries are generated from Large Language Models (LLMs) to identify attack progressions in alert data, and to correlate and identify related entities and events. When possible, attack progressions are attributed to threat actors. ### Details Users may generate attack discoveries from a variety of LLMs, configured via [Connectors](https://www.elastic.co/guide/en/kibana/master/action-types.html):  _Above: LLM selection via the connectors popup menu_ Clicking on the title of an attack discovery toggles the discovery between the collapsed and expanded state:  _Above: Collapsing / expanding an attack discovery (animated gif)_ The first three discoveries displayed on the Attack discoveries page are expanded by default. Any additional discoveries that appear after the first three must be expanded manually. Attack discoveries provide a summary of the entities impacted by an attack. Clicking on an entity, i.e. a hostname or username, displays the entity flyout with the entity's risk summary:  _Above: Clicking on a host in the summary of the attack discovery reveals the host risk summary (animated gif)_ Hover over fields in the discovery's summary or details to reveal pivot actions for investigations:  _Above: Hovering over fields in the details of an attack discovery reveals pivot actions (animated gif)_ Attack discoveries are generated from alerts provided as context to the selected LLM. The alert data provided to the LLM is anonymized automatically. Anonymization is [configured](https://www.elastic.co/guide/en/security/current/security-assistant.html#ai-assistant-anonymization) via the same anonymization settings as the Assistant. Users may override the defaults to allow or deny specific alert fields, and to toggle anonymization on or off for specific fields. Click the Anonymization toggle to show or hide the actual values sent to the LLM:  _Above: Toggling anonymization to reveal the actual values sent to the LLM (animated gif)_ ### Empty prompt At the start of a session, or when a user selects a connector that doesn't (yet) have any attack discoveries, an [empty prompt](https://eui.elastic.co/#/display/empty-prompt) is displayed. The animated counter in the empty prompt counts up until it displays the maximum number of alerts that will be sent to the LLM:  _Above: An animated counter displays the maximum number of alerts that will be sent to the LLM (animiated gif)_ The _Settings_ section of this PR details how users configure the number of alerts sent to the LLM. The animated counter in the empty prompt immediately re-animates to the newly-selected number when the setting is updated. ### Take action workflows The _Take action_ popover displays the following actions: - `Add to new case` - `Add to existing case` - `View in AI Assistant`  _Above: The Take action popover_ #### Add to new case Clicking the `Add to new` case action displays the `Create case` flyout.  _Above: The `Add to new case` workflow_ An `Alerts were added to <case name>` toast is displayed when the case is created:  _Above: Case creation toast_ A markdown representation of the attack discovery is added to the case:  _Above: A markdown representation of an attack discovery in a case_ The alerts correlated to generate the discovery are attached to the case:  _Above: Attack discovery alerts attached to a case_ #### Add to existing case Clicking the `Add to existing case` action displays the `Select case` popover.  _Above: The `Select case` popover_ When users select an existing case, a markdown representation of the attack discovery, and the alerts correlated to generate the discovery are attached to the case, as described above in the _Add to new case_ section. #### View in AI Assistant The `View in AI Assistant` action in the `Take action` popover, and two additional `View in AI Assistant` affordances that appear in each discovery have the same behavior: Clicking `View in AI Assistant` opens the assistant and adds the attack discovery as context to the current conversation.  _Above: An attack discovery added as context to the current conversation_ Clicking on the attack discovery in the assistant expands it to reveal a preview of the discovery.  _Above: An expanded attack discovery preview in the assistant_ The expanded attack discovery preview reveals the number of anonymzied fields from the discovery that were made available to the conversation. This feature ensures discoveries are added to a conversation with the anonymized field values. An attack discovery viewed in the AI assistant doesn't become part of the conversation until the user submits it by asking a question, e.g. `How do I remediate this?`. Attack discoveries provided as context to a conversation are formatted as markdown when sent to the LLM:  _Above: Attack discoveries provided as context to a conversation are formatted as markdown_ Users may toggle anonymization in the conversation to reveal the original field values.  _Above: Revealing the original field values of an attack discovery added as markdown to a conversation (animated gif)_ #### Alerts tab The _Alerts_ tab displays the alerts correlated to generate the discovery.  _Above: The alerts correlated to generate the attack discovery in the Alerts tab_ The `View details`, `Investigate in timeline`, and overflow row-level alert actions displayed in the Alerts tab are the same actions available on the Cases's page's Alerts tab:  _Above: Row-level actions are the same as the Cases pages Alert's tab_ #### Investigate in Timeline Click an attack discovery's `Investigate in Timeline` button to begin an investigation of an discovery's alerts in Timeline. Alert IDs are queried via the `Alert Ids` filter:  _Above: Clicking Investigate in Timeline (animated gif)_ The alerts from the attack discovery are explained via row renderers in Timeline:  _Above: Row rendered attack discovery alerts in Timeline_ ### Attack Chain When alerts are indicative of attack [tactics](https://attack.mitre.org/tactics/enterprise/), those tactics are displayed in the discovery's _Attack Chain_ section:  _Above: An attack discovery with tactics in the Attack chain_ The Attack Chain section will be hidden if an attack discovery is not indicative of specific tactics. ### Mini attack chain Every attack discovery includes a mini attack chain that visually summarizes the tactics in a discovery. Hovering over the mini attack chain reveals a tooltip with the details:  _Above: The mini attack chain tooltip_ ### Storage The latest attack discoveries generated for each connector are cached in the browser's session storage in the following key: ``` elasticAssistantDefault.attackDiscovery.default.cachedAttackDiscoveries ``` Caching attack discoveries in session storage makes it possible to immediately display the latest when users return to the Attack discoveries page from other pages in the security solution (e.g. Cases).  _Above: Cached attack discoveries from session storage are immediately displayed when users navigate back to Attack discoveries (animated gif)_ While waiting for a connector to generate results, users may view the cached results from other connectors. Cached attack discoveries are immediately available, even after a full page refresh, as long as the browser session is still active. ### `Approximate time remaining` / `Above average time` counters Some LLMs may take seconds, or even minutes to generate attack discoveries. To help users anticipate the time it might take to generate new discoveries, the page displays a `Approximate time remaining: mm:ss` countdown timer that counts down to zero from the average time it takes to generate discoveries for the selected LLM:  _Above: The `Approximate time remaining: mm:ss` countdown counter (animated gif)_ If the LLM doesn't generate attack discoveries before the counter reaches zero, the text will change from `Approximate time remaining: mm:ss` to `Above average time: mm:ss`, and start counting up from `00:00` until the attack discoveries are generated:  _Above: The `Above average time: mm:ss` counter (animated gif)_ The first time attack discoveries are generated for a model, the `Approximate time remaining: mm:ss` counter is not displayed. Average time is calculated over the last 5 generations on the selected connector. This is illustrated by clicking on the (?) information icon next to the timer. The popover displays the average time, and the time in seconds for the last 5 runs:  _Above: Clicking on the (?) information icon displays the average time, and the duration / datetimes for the last 5 generations_ The time and duration of the last 5 generations (for each connector) are persisted in the browser's local storage in the following key: ``` elasticAssistantDefault.attackDiscovery.default.generationIntervals ``` ### Errors When attack discovery generation fails, an error toaster is displayed to explain the failure:  _Above: An error toast explains why attack discovery generation failed_ ### Feature flag The `attackDiscoveryEnabled` feature flag must be enabled to view the `Attack discovery` link in the Security Solution's global navigation. Add the `attackDiscoveryEnabled` feature flag to the `xpack.securitySolution.enableExperimental` setting in `config/kibana.yml` (or `config/kibana.dev.yml` in local development environments), per the example below: ``` xpack.securitySolution.enableExperimental: ['attackDiscoveryEnabled'] ``` ### Settings The number of alerts sent as context to the LLM is configured by `Knowledge Base` > `Alerts` slider in the screenshot below:  - The slider has a range of `10` - `100` alerts (default: `20`) Up to `n` alerts (as determined by the slider) that meet the following criteria will be returned: - The `kibana.alert.workflow_status` must be `open` - The alert must have been generated in the last `24 hours` - The alert must NOT be a `kibana.alert.building_block_type` alert - The `n` alerts are ordered by `kibana.alert.risk_score`, to prioritize the riskiest alerts ### License An Enterprise license is required to use Attack discovery. The following empty view is displayed for users who don't have an Enterprise license:  ## How it works - Users navigate to the Attack discovery page: `x-pack/plugins/security_solution/public/attack_discovery/pages/index.tsx` - When users click the `Generate` button(s) on the Attack discovery page, attack discoveries are fetched via the `useAttackDiscovery` hook in `x-pack/plugins/security_solution/public/attack_discovery/use_attack_discovery/index.tsx`. - The `fetchAttackDiscoveries` function makes an http `POST` request is made to the `/internal/elastic_assistant/attack_discovery` route. Requests include the following parameters: - `actionTypeId`, determines temperature and other connector-specific request parameters - `alertsIndexPattern`, the alerts index for the current Kibana Space, e.g. `.alerts-security.alerts-default` - `anonymizationFields`, the user's `Allowed` and (when applicable `Anonymized` ) fields in the `Anonymization` settings, e.g. `["@timestamp", "cloud.availability_zone", "file.name", "user.name", ...]` - `connectorId`, id of the connector to generate the attack discoveries - `size`, the maximum number of alerts to generate attack discoveries from. This numeric value is set by the slider in the user's `Knowledge Base > Alerts` setting, e.g. `20` - `replacements`, an optional `Record<string, string>` collection of replacements that's always empty in the current implementation. When non-empty, this collection enables new attack discoveries to be generated using existing replacements. ```json "replacements": { "e4f935c0-5a80-47b2-ac7f-816610790364": "Host-itk8qh4tjm", "cf61f946-d643-4b15-899f-6ffe3fd36097": "rpwmjvuuia", "7f80b092-fb1a-48a2-a634-3abc61b32157": "6astve9g6s", "f979c0d5-db1b-4506-b425-500821d00813": "Host-odqbow6tmc", // ... }, ``` - The `postAttackDiscoveryRoute` function in `x-pack/plugins/elastic_assistant/server/routes/attack_discovery/post_attack_discovery.ts` handles the request. - The inputs and outputs to/from this route are defined by the [OpenAPI](https://spec.openapis.org/oas/v3.1.0) schema in `x-pack/packages/kbn-elastic-assistant-common/impl/schemas/attack_discovery/post_attack_discovery_route.schema.yaml`. ``` node scripts/generate_openapi --rootDir ./x-pack/packages/kbn-elastic-assistant-common ``` - The `postAttackDiscoveryRoute` route handler function in `x-pack/plugins/elastic_assistant/server/routes/attack_discovery/post_attack_discovery.ts` invokes the `attack-discovery` tool, defined in `x-pack/plugins/security_solution/server/assistant/tools/attack_discovery/attack_discovery_tool.ts`. The `attack-discovery` tool is registered by the Security Solution. Note: The `attack-discovery` tool is only used by the attack discovery page. It is not used to generate new attack discoveries from the context of an assistant conversation, but that feature could be enabled in a future release. - The `attack-discovery` tool uses a LangChain `OutputFixingParser` to create a [prompt sandwich](https://www.elastic.co/blog/crafting-prompt-sandwiches-generative-ai) with the following parts: ``` ______________________________________________________ / \ | Attack discovery JSON formatting instructions | (1) \ _____________________________________________________/ +-----------------------------------------------------+ | Attack discovery prompt | (2) +-----------------------------------------------------+ / \ | Anonymized Alerts | (3) \_____________________________________________________/ ``` - The `Attack discovery JSON formatting instructions` in section `(1)` of the prompt sandwich are defined in the `getOutputParser()` function in `x-pack/plugins/security_solution/server/assistant/tools/attack_discovery/get_output_parser.ts`. This function creates a LangChain `StructuredOutputParser` from a Zod schema. This parser validates responses from the LLM to ensure they are formatted as JSON representing an attack discovery. - The `Attack discovery prompt` in section `(2)` of the prompt sandwich is defined in the `getAttackDiscoveryPrompt()` function in `x-pack/plugins/security_solution/server/assistant/tools/attack_discovery/get_attack_discovery_prompt.ts`. This part of the prompt sandwich includes instructions for correlating alerts, and additional instructions to the LLM for formatting JSON. - The `Anonymized Alerts` in section `(3)` of the prompt sandwich are returned by the `getAnonymizedAlerts()` function in `x-pack/plugins/security_solution/server/assistant/tools/attack_discovery/get_anonymized_alerts.ts`. The allow lists configured by the user determine which alert fields will be included and anonymized. - The `postAttackDiscoveryRoute` route handler returns the attack discoveries generated by the `attack-discovery` tool to the client (browser). - Attack discoveries are rendered in the browser via the `AttackDiscoveryPanel` component in `x-pack/plugins/security_solution/public/attack_discovery/attack_discovery_panel/index.tsx` - The `AttackDiscoveryTab` tab in `x-pack/plugins/security_solution/public/attack_discovery/attack_discovery_panel/tabs/attack_discovery_tab/index.tsx` includes the _Summary_ and _Details_ section of the attack discovery. - The `AttackDiscoveryMarkdownFormatter` in `x-pack/plugins/security_solution/public/attack_discovery/attack_discovery_markdown_formatter/index.tsx` renders hover actions on entities (like hostnames and usernames) and other fields in the attack discovery. - The `AttackDiscoveryPanel` component makes use of the `useAssistantOverlay` hook in `x-pack/packages/kbn-elastic-assistant/impl/assistant/use_assistant_overlay/index.tsx` to register the attack discovery as context with the assistant. This registration process makes it possible to view discoveries in the assistant, and ask questions like "How do I remediate this?". In this feature, the `useAssistantOverlay` hook was enhanced to accept anonymizaton replacements. This enables an assistant conversation to (re)use replacements originally generated for an attack discovery.
## [Security Solution] [Attack discovery] Attack discovery ### Summary This PR renames the _Attack discovery_ Security Solution feature from its original name, [AI Insights](elastic#180611).  _Above: Attack discovery in the Security Solution_ Attack discovery uses AI to identify active attacks in the environment, without the time (or prior experience) required to manually investigate individual alerts in Elastic Security, identify if they are related, and document the identified attack progression. While users can ask the Assistant to find these progressions today, Attack discovery is a dedicated UI to identify these progressions and action them accordingly. This feature adds a new page, `Attack discovery`, to the Security Solution's global navigation. Attack discoveries are generated from Large Language Models (LLMs) to identify attack progressions in alert data, and to correlate and identify related entities and events. When possible, attack progressions are attributed to threat actors. ### Details Users may generate attack discoveries from a variety of LLMs, configured via [Connectors](https://www.elastic.co/guide/en/kibana/master/action-types.html):  _Above: LLM selection via the connectors popup menu_ Clicking on the title of an attack discovery toggles the discovery between the collapsed and expanded state:  _Above: Collapsing / expanding an attack discovery (animated gif)_ The first three discoveries displayed on the Attack discoveries page are expanded by default. Any additional discoveries that appear after the first three must be expanded manually. Attack discoveries provide a summary of the entities impacted by an attack. Clicking on an entity, i.e. a hostname or username, displays the entity flyout with the entity's risk summary:  _Above: Clicking on a host in the summary of the attack discovery reveals the host risk summary (animated gif)_ Hover over fields in the discovery's summary or details to reveal pivot actions for investigations:  _Above: Hovering over fields in the details of an attack discovery reveals pivot actions (animated gif)_ Attack discoveries are generated from alerts provided as context to the selected LLM. The alert data provided to the LLM is anonymized automatically. Anonymization is [configured](https://www.elastic.co/guide/en/security/current/security-assistant.html#ai-assistant-anonymization) via the same anonymization settings as the Assistant. Users may override the defaults to allow or deny specific alert fields, and to toggle anonymization on or off for specific fields. Click the Anonymization toggle to show or hide the actual values sent to the LLM:  _Above: Toggling anonymization to reveal the actual values sent to the LLM (animated gif)_ ### Empty prompt At the start of a session, or when a user selects a connector that doesn't (yet) have any attack discoveries, an [empty prompt](https://eui.elastic.co/#/display/empty-prompt) is displayed. The animated counter in the empty prompt counts up until it displays the maximum number of alerts that will be sent to the LLM:  _Above: An animated counter displays the maximum number of alerts that will be sent to the LLM (animiated gif)_ The _Settings_ section of this PR details how users configure the number of alerts sent to the LLM. The animated counter in the empty prompt immediately re-animates to the newly-selected number when the setting is updated. ### Take action workflows The _Take action_ popover displays the following actions: - `Add to new case` - `Add to existing case` - `View in AI Assistant`  _Above: The Take action popover_ #### Add to new case Clicking the `Add to new` case action displays the `Create case` flyout.  _Above: The `Add to new case` workflow_ An `Alerts were added to <case name>` toast is displayed when the case is created:  _Above: Case creation toast_ A markdown representation of the attack discovery is added to the case:  _Above: A markdown representation of an attack discovery in a case_ The alerts correlated to generate the discovery are attached to the case:  _Above: Attack discovery alerts attached to a case_ #### Add to existing case Clicking the `Add to existing case` action displays the `Select case` popover.  _Above: The `Select case` popover_ When users select an existing case, a markdown representation of the attack discovery, and the alerts correlated to generate the discovery are attached to the case, as described above in the _Add to new case_ section. #### View in AI Assistant The `View in AI Assistant` action in the `Take action` popover, and two additional `View in AI Assistant` affordances that appear in each discovery have the same behavior: Clicking `View in AI Assistant` opens the assistant and adds the attack discovery as context to the current conversation.  _Above: An attack discovery added as context to the current conversation_ Clicking on the attack discovery in the assistant expands it to reveal a preview of the discovery.  _Above: An expanded attack discovery preview in the assistant_ The expanded attack discovery preview reveals the number of anonymzied fields from the discovery that were made available to the conversation. This feature ensures discoveries are added to a conversation with the anonymized field values. An attack discovery viewed in the AI assistant doesn't become part of the conversation until the user submits it by asking a question, e.g. `How do I remediate this?`. Attack discoveries provided as context to a conversation are formatted as markdown when sent to the LLM:  _Above: Attack discoveries provided as context to a conversation are formatted as markdown_ Users may toggle anonymization in the conversation to reveal the original field values.  _Above: Revealing the original field values of an attack discovery added as markdown to a conversation (animated gif)_ #### Alerts tab The _Alerts_ tab displays the alerts correlated to generate the discovery.  _Above: The alerts correlated to generate the attack discovery in the Alerts tab_ The `View details`, `Investigate in timeline`, and overflow row-level alert actions displayed in the Alerts tab are the same actions available on the Cases's page's Alerts tab:  _Above: Row-level actions are the same as the Cases pages Alert's tab_ #### Investigate in Timeline Click an attack discovery's `Investigate in Timeline` button to begin an investigation of an discovery's alerts in Timeline. Alert IDs are queried via the `Alert Ids` filter:  _Above: Clicking Investigate in Timeline (animated gif)_ The alerts from the attack discovery are explained via row renderers in Timeline:  _Above: Row rendered attack discovery alerts in Timeline_ ### Attack Chain When alerts are indicative of attack [tactics](https://attack.mitre.org/tactics/enterprise/), those tactics are displayed in the discovery's _Attack Chain_ section:  _Above: An attack discovery with tactics in the Attack chain_ The Attack Chain section will be hidden if an attack discovery is not indicative of specific tactics. ### Mini attack chain Every attack discovery includes a mini attack chain that visually summarizes the tactics in a discovery. Hovering over the mini attack chain reveals a tooltip with the details:  _Above: The mini attack chain tooltip_ ### Storage The latest attack discoveries generated for each connector are cached in the browser's session storage in the following key: ``` elasticAssistantDefault.attackDiscovery.default.cachedAttackDiscoveries ``` Caching attack discoveries in session storage makes it possible to immediately display the latest when users return to the Attack discoveries page from other pages in the security solution (e.g. Cases).  _Above: Cached attack discoveries from session storage are immediately displayed when users navigate back to Attack discoveries (animated gif)_ While waiting for a connector to generate results, users may view the cached results from other connectors. Cached attack discoveries are immediately available, even after a full page refresh, as long as the browser session is still active. ### `Approximate time remaining` / `Above average time` counters Some LLMs may take seconds, or even minutes to generate attack discoveries. To help users anticipate the time it might take to generate new discoveries, the page displays a `Approximate time remaining: mm:ss` countdown timer that counts down to zero from the average time it takes to generate discoveries for the selected LLM:  _Above: The `Approximate time remaining: mm:ss` countdown counter (animated gif)_ If the LLM doesn't generate attack discoveries before the counter reaches zero, the text will change from `Approximate time remaining: mm:ss` to `Above average time: mm:ss`, and start counting up from `00:00` until the attack discoveries are generated:  _Above: The `Above average time: mm:ss` counter (animated gif)_ The first time attack discoveries are generated for a model, the `Approximate time remaining: mm:ss` counter is not displayed. Average time is calculated over the last 5 generations on the selected connector. This is illustrated by clicking on the (?) information icon next to the timer. The popover displays the average time, and the time in seconds for the last 5 runs:  _Above: Clicking on the (?) information icon displays the average time, and the duration / datetimes for the last 5 generations_ The time and duration of the last 5 generations (for each connector) are persisted in the browser's local storage in the following key: ``` elasticAssistantDefault.attackDiscovery.default.generationIntervals ``` ### Errors When attack discovery generation fails, an error toaster is displayed to explain the failure:  _Above: An error toast explains why attack discovery generation failed_ ### Feature flag The `attackDiscoveryEnabled` feature flag must be enabled to view the `Attack discovery` link in the Security Solution's global navigation. Add the `attackDiscoveryEnabled` feature flag to the `xpack.securitySolution.enableExperimental` setting in `config/kibana.yml` (or `config/kibana.dev.yml` in local development environments), per the example below: ``` xpack.securitySolution.enableExperimental: ['attackDiscoveryEnabled'] ``` ### Settings The number of alerts sent as context to the LLM is configured by `Knowledge Base` > `Alerts` slider in the screenshot below:  - The slider has a range of `10` - `100` alerts (default: `20`) Up to `n` alerts (as determined by the slider) that meet the following criteria will be returned: - The `kibana.alert.workflow_status` must be `open` - The alert must have been generated in the last `24 hours` - The alert must NOT be a `kibana.alert.building_block_type` alert - The `n` alerts are ordered by `kibana.alert.risk_score`, to prioritize the riskiest alerts ### License An Enterprise license is required to use Attack discovery. The following empty view is displayed for users who don't have an Enterprise license:  ## How it works - Users navigate to the Attack discovery page: `x-pack/plugins/security_solution/public/attack_discovery/pages/index.tsx` - When users click the `Generate` button(s) on the Attack discovery page, attack discoveries are fetched via the `useAttackDiscovery` hook in `x-pack/plugins/security_solution/public/attack_discovery/use_attack_discovery/index.tsx`. - The `fetchAttackDiscoveries` function makes an http `POST` request is made to the `/internal/elastic_assistant/attack_discovery` route. Requests include the following parameters: - `actionTypeId`, determines temperature and other connector-specific request parameters - `alertsIndexPattern`, the alerts index for the current Kibana Space, e.g. `.alerts-security.alerts-default` - `anonymizationFields`, the user's `Allowed` and (when applicable `Anonymized` ) fields in the `Anonymization` settings, e.g. `["@timestamp", "cloud.availability_zone", "file.name", "user.name", ...]` - `connectorId`, id of the connector to generate the attack discoveries - `size`, the maximum number of alerts to generate attack discoveries from. This numeric value is set by the slider in the user's `Knowledge Base > Alerts` setting, e.g. `20` - `replacements`, an optional `Record<string, string>` collection of replacements that's always empty in the current implementation. When non-empty, this collection enables new attack discoveries to be generated using existing replacements. ```json "replacements": { "e4f935c0-5a80-47b2-ac7f-816610790364": "Host-itk8qh4tjm", "cf61f946-d643-4b15-899f-6ffe3fd36097": "rpwmjvuuia", "7f80b092-fb1a-48a2-a634-3abc61b32157": "6astve9g6s", "f979c0d5-db1b-4506-b425-500821d00813": "Host-odqbow6tmc", // ... }, ``` - The `postAttackDiscoveryRoute` function in `x-pack/plugins/elastic_assistant/server/routes/attack_discovery/post_attack_discovery.ts` handles the request. - The inputs and outputs to/from this route are defined by the [OpenAPI](https://spec.openapis.org/oas/v3.1.0) schema in `x-pack/packages/kbn-elastic-assistant-common/impl/schemas/attack_discovery/post_attack_discovery_route.schema.yaml`. ``` node scripts/generate_openapi --rootDir ./x-pack/packages/kbn-elastic-assistant-common ``` - The `postAttackDiscoveryRoute` route handler function in `x-pack/plugins/elastic_assistant/server/routes/attack_discovery/post_attack_discovery.ts` invokes the `attack-discovery` tool, defined in `x-pack/plugins/security_solution/server/assistant/tools/attack_discovery/attack_discovery_tool.ts`. The `attack-discovery` tool is registered by the Security Solution. Note: The `attack-discovery` tool is only used by the attack discovery page. It is not used to generate new attack discoveries from the context of an assistant conversation, but that feature could be enabled in a future release. - The `attack-discovery` tool uses a LangChain `OutputFixingParser` to create a [prompt sandwich](https://www.elastic.co/blog/crafting-prompt-sandwiches-generative-ai) with the following parts: ``` ______________________________________________________ / \ | Attack discovery JSON formatting instructions | (1) \ _____________________________________________________/ +-----------------------------------------------------+ | Attack discovery prompt | (2) +-----------------------------------------------------+ / \ | Anonymized Alerts | (3) \_____________________________________________________/ ``` - The `Attack discovery JSON formatting instructions` in section `(1)` of the prompt sandwich are defined in the `getOutputParser()` function in `x-pack/plugins/security_solution/server/assistant/tools/attack_discovery/get_output_parser.ts`. This function creates a LangChain `StructuredOutputParser` from a Zod schema. This parser validates responses from the LLM to ensure they are formatted as JSON representing an attack discovery. - The `Attack discovery prompt` in section `(2)` of the prompt sandwich is defined in the `getAttackDiscoveryPrompt()` function in `x-pack/plugins/security_solution/server/assistant/tools/attack_discovery/get_attack_discovery_prompt.ts`. This part of the prompt sandwich includes instructions for correlating alerts, and additional instructions to the LLM for formatting JSON. - The `Anonymized Alerts` in section `(3)` of the prompt sandwich are returned by the `getAnonymizedAlerts()` function in `x-pack/plugins/security_solution/server/assistant/tools/attack_discovery/get_anonymized_alerts.ts`. The allow lists configured by the user determine which alert fields will be included and anonymized. - The `postAttackDiscoveryRoute` route handler returns the attack discoveries generated by the `attack-discovery` tool to the client (browser). - Attack discoveries are rendered in the browser via the `AttackDiscoveryPanel` component in `x-pack/plugins/security_solution/public/attack_discovery/attack_discovery_panel/index.tsx` - The `AttackDiscoveryTab` tab in `x-pack/plugins/security_solution/public/attack_discovery/attack_discovery_panel/tabs/attack_discovery_tab/index.tsx` includes the _Summary_ and _Details_ section of the attack discovery. - The `AttackDiscoveryMarkdownFormatter` in `x-pack/plugins/security_solution/public/attack_discovery/attack_discovery_markdown_formatter/index.tsx` renders hover actions on entities (like hostnames and usernames) and other fields in the attack discovery. - The `AttackDiscoveryPanel` component makes use of the `useAssistantOverlay` hook in `x-pack/packages/kbn-elastic-assistant/impl/assistant/use_assistant_overlay/index.tsx` to register the attack discovery as context with the assistant. This registration process makes it possible to view discoveries in the assistant, and ask questions like "How do I remediate this?". In this feature, the `useAssistantOverlay` hook was enhanced to accept anonymizaton replacements. This enables an assistant conversation to (re)use replacements originally generated for an attack discovery. (cherry picked from commit a053557)
[Security Solution] [AI Insights] AI Insights
Summary
This PR introduces AI Insights to the Security Solution:
Above: AI Insights in the Security Solution
AI Insights identify active attacks in the environment, without the time (or prior experience) required to manually investigate individual alerts in Elastic Security, identify if they are related, and document the identified attack progression.
While users can ask the Assistant to find these progressions today, AI Insights is a dedicated UI to identify these progressions and action them accordingly. This feature adds a new page,
AI Insights, to the Security Solution's global navigation.AI Insights are generated from Large Language Models (LLMs) to identify attack progressions in alert data, and to correlate and identify related entities and events. When possible, attack progressions are attributed to threat actors.
Details
Users may generate insights from a varetiy of LLMs, configured via Connectors:
Above: LLM selection via the connectors popup menu
Clicking on the title of an insight toggles the insight between the collapsed and expanded state:
Above: Collapsing / expanding an insight (animated gif)
The first three insights displayed on the AI Insights page are expanded by default. Any additional insights that appear after the first three must be expanded manually.
Insights provide a summary of the entities impacted by an attack. Clicking on an entity, i.e. a hostname or username, displays the entity flyout with the entity's risk summary:
Above: Clicking on a host in the summary of the insight reveals the host risk summary (animated gif)
Hover over fields in the insight's summary or details to reveal pivot actions for investigations:
Above: Hovering over fields in the details of an insight reveals pivot actions (animated gif)
Insights are generated from alerts provided as context to the selected LLM. The alert data provided to the LLM is anonymized automatically. Anonymization is configured via the same anonymization settings as the Assistant. Users may override the defaults to allow or deny specific alert fields, and to toggle anonymization on or off for specific fields.
Click the Anonymization toggle to show or hide the actual values sent to the LLM:
Above: Toggling anonymization to reveal the actual values sent to the LLM (animated gif)
Empty prompt
At the start of a session, or when a user selects a connector that doesn't (yet) have any insights, an empty prompt is displayed.
The animated counter in the empty prompt counts up until it displays the maximum number of alerts that will be sent to the LLM:
Above: An animated counter displays the maximum number of alerts that will be sent to the LLM (animiated gif)
The Settings section of this PR details how users configure the number of alerts sent to the LLM. The animated counter in the empty prompt immediately re-animates to the newly-selected number when the setting is updated.
Take action workflows
The Take action popover displays the following actions:
Add to new caseAdd to existing caseView in AI AssistantAbove: The Take action popover
Add to new case
Clicking the
Add to newcase action displays theCreate caseflyout.Above: The
Add to new caseworkflowAn
Alerts were added to <case name>toast is displayed when the case is created:Above: Case creation toast
A markdown representation of the insight is added to the case:
Above: A markdown representation of an insight in a case
The alerts correlated to generate the insight are attached to the case:
Above: Insight alerts attached to a case
Add to existing case
Clicking the
Add to existing caseaction displays theSelect casepopover.Above: The
Select casepopoverWhen users select an existing case, a markdown representation of the insight, and the alerts correlated to generate the insight are attached to the case, as described above in the Add to new case section.
View in AI Assistant
The
View in AI Assistantaction in theTake actionpopover, and two additionalView in AI Assistantaffordances that appear in each insight have the same behavior:Clicking
View in AI Assistantopens the assistant and adds the insight as context to the current conversation.Above: An insight added as context to the current conversation
Clicking on the insight in the assistant expands it to reveal a preview of the insight.
Above: An expanded insight preview in the assistant
The expanded insight preview reveals the number of anonymzied fields from the insight that were made available to the conversation. This feature ensures insights are added to a conversation with the anonymized field values.
An insight viewed in the AI assistant doesn't become part of the conversation until the user submits it by asking a question, e.g.
How do I remediate this?.Insights provided as context to a conversation are formatted as markdown when sent to the LLM:
Above: Insights provided as context to a conversation are formatted as markdown
Users may toggle anonymization in the conversation to reveal the original field values.
Above: Revealing the original field values of an insight added as markdown to a conversation (animated gif)
Alerts tab
The Alerts tab displays the alerts correlated to generate the insight.
Above: The alerts correlated to generate the insight in the Alerts tab
The
View details,Investigate in timeline, and overflow row-level alert actions displayed in the Alerts tab are the same actions available on the Cases's page's Alerts tab:Above: Row-level actions are the same as the Cases pages Alert's tab
Investigate in Timeline
Click an insight's
Investigate in Timelinebutton to begin an investigation of an insights's alerts in Timeline. Alert IDs are queried via theAlert Idsfilter:Above: Clicking Investigte in Timeline (animated gif)
The alerts from the insight are explained via row renderers in Timeline:
Above: Row rendered insight alerts in Timeline
Attack Chain
When alerts are indicative of attack tactics, those tactics are displayed in the insights's Attack Chain section:
Above: An insight with tactics in the Attach chain
The Attack Chain section will be hidden if an insight is not indicative of specific tactics.
Mini attack chain
Every insight includes a mini attack chain that visually summarizes the tactics in an insight. Hovering over the mini attack chain reveals a tooltip with the details:
Above: The mini attack chain tooltip
Storage
The latest insights generated for each connector are cached in the browser's session storage in the following key:
Caching insights in session storage makes it possible to immediately display the latest when users return to to the AI insights page from other pages in the security solution (e.g. Cases).
Above: Cached insights from sesion storage are immediately displayed when users navigate back to AI Insights (animated gif)
While waiting for a connector to generate results, users may view the cached results from other connectors.
Cached insights are immediately available, even after a full page refresh, as long as the browser session is still active.
Approximate time remaining/Above average timecountersSome LLMs may take seconds, or even minutes to generate insights. To help users anticipate the time it might take to generate an insight, the AI insights feature displays a
Approximate time remaining: mm:sscountdown timer that counts down to zero from the average time it takes to generate an insight for the selected LLM:Above: The
Approximate time remaining: mm:sscountdown counter (animated gif)If the LLM doesn't generate insights before the counter reaches zero, the text will change from
Approximate time remaining: mm:sstoAbove average time: mm:ss, and start counting up from00:00until the insights are generated:Above: The
Above average time: mm:sscounter (animated gif)The first time insights are generated for a model, the
Approximate time remaining: mm:sscounter is not displayed.Average time is calculated over the last 5 generations on the selected connector. This is illustrated by clicking on the (?) information icon next to the timer. The popover displays the average time, and the time in seconds for the last 5 runs:
Above: Clicking on the (?) information icon displays the average time, and the duration / datetimes for the last 5 generations
The time and duration of the last 5 generations (for each connector) are persisted in the browser's local storage in the following key:
Errors
When insight generation fails, an error toaster is displayed to explain the failure:
Above: An error toaster explains why insights generation failed
Feature flag
The
assistantAlertsInsightsfeature flag must be enabled to view theAI Insightslink in the Security Solution's global navigation.Add the
assistantAlertsInsightsfeature flag to thexpack.securitySolution.enableExperimentalsetting inconfig/kibana.yml(orconfig/kibana.dev.ymlin local development environments), per the example below:Settings
The number of alerts sent as context to the LLM is configured by
Knowledge Base>Alertsslider in the screenshot below:10-100alerts (default:20)Up to
nalerts (as determined by the slider) that meet the following criteria will be returned:kibana.alert.workflow_statusmust beopen24 hourskibana.alert.building_block_typealertnalerts are ordered bykibana.alert.risk_score, to prioritize the riskiest alertsLicense
An Enterprise license is required to use AI Insights.
The following AI Insights view is displayed for users who don't have an Enterprise license:
How it works
Users navigate to the AI insights page:
x-pack/plugins/security_solution/public/ai_insights/pages/index.tsxWhen users click the
Generatebutton(s) on the AI Insights page, insights are fetched via theuseInsightshook inx-pack/plugins/security_solution/public/ai_insights/use_insights/index.tsx.The
fetchInsightsfunction makes an httpPOSTrequest is made to the/internal/elastic_assistant/insights/alertsroute. include the following new (optional) parameters:actionTypeId, determines tempature and other connector-specific request parametersalertsIndexPattern, the alerts index for the current Kibana Space, e.g..alerts-security.alerts-defaultallow, the user'sAllowedfields in theAnonymizationsettings, e.g.["@timestamp", "cloud.availability_zone", "file.name", "user.name", ...]allowReplacement, the user'sAnonymizedfields in theAnonymizationsettings, e.g.["cloud.availability_zone", "host.name", "user.name", ...]connectorId, id of the connector to generate the insightsreplacements, an optionalRecord<string, string>collection of replacements that always empty in the current implementation. When non-empty, this collection enables new insights to be generated using existing replacements.size, the maximum number of alerts to generate insights from. This numeric value is set by the slider in the user'sKnowledge Base > Alertssetting, e.g.20The
postAlertsInsightsRoutefunction inx-pack/plugins/elastic_assistant/server/routes/insights/alerts/post_alerts_insights.tshandles the request.The inputs and outputs to this route are defined by the OpenAPI schema in
x-pack/packages/kbn-elastic-assistant-common/impl/schemas/insights/alerts/post_alerts_insights_route.schema.yaml.postAlertsInsightsRouteroute handler function inx-pack/plugins/elastic_assistant/server/routes/insights/alerts/post_alerts_insights.tsinvokes theinsights-tool, defined inx-pack/plugins/security_solution/server/assistant/tools/insights/insights_tool.ts.The
insights-toolis registered by the Security Solution. Note: Theinsights-toolis only used for generating insights. It is not used to generate new insights from the context of an assistant conversation, but that feature could be enabled in a future release.insights-tooluses a LangChainOutputFixingParserto create a prompt sandwich with the following parts:The
Insight JSON formatting instructionsin section(1)of the prompt sandwich are defined in thegetOutputParser()function inx-pack/plugins/security_solution/server/assistant/tools/insights/get_output_parser.ts. This function creates a LangChainStructuredOutputParserfrom a Zod schema. This parser validates responses from the LLM to ensure they are formatted as JSON representing an insight.The
Insights promptin section(2)of the prompt sandwich is defined in thegetInsightsPrompt()function inx-pack/plugins/security_solution/server/assistant/tools/insights/get_insights_prompt.ts. This part of the prompt sandwich includes instructions for correlating insights, and additional instructions to the LLM for formatting JSON.The
Anonymized Alertsin section(3)of the prompt sandwich are returned by thegetAnonymizedAlerts()function inx-pack/plugins/security_solution/server/assistant/tools/insights/get_anonymized_alerts.ts. The allow lists configured by the user determine which alert fields will be included and anonymized.The
postAlertsInsightsRouteroute handler returns the insights generated by theinsights-toolto the client (browser).Insights are rendered in the browser via the
Insightcomponent inx-pack/plugins/security_solution/public/ai_insights/insight/index.tsxThe
AiInsightstab inx-pack/plugins/security_solution/public/ai_insights/insight/tabs/ai_insights/index.tsxincludes the Summary and Details section of the Insight.The
InsightMarkdownFormatterinx-pack/plugins/security_solution/public/ai_insights/insight_markdown_formatter/index.tsxrenders hover actions on entities (like hostnames and usernames) and other fields in the insight.The
Insightcomponent makes use of theuseAssistantOverlayhook inx-pack/packages/kbn-elastic-assistant/impl/assistant/use_assistant_overlay/index.tsxto register the insight as context with the assistant. This registration process makes it possible to view insights in the assistant, and ask questions like "How do I remediate this?". In this PR, theuseAssistantOverlayhook was enhanced to accept anonymizaton replacements. This enables an assistant conversation to (re)use replacements originally generated for an insight.