Knights et al. (2021). Does Hemispheric Asymmetry Reduction in Older Adults (HAROLD) in motor cortex reflect compensation? Journal of Neuroscience, (45), 9361-9373.
- R
- MASS
- ggplot2
- brms
- bayesfactor
- Matlab
- SPM
- Python
- sklearn
- numpy
- Datasets
- For ROIs (definition/timeseries extraction) & multivariate procedures (MVB, MVPA):
- MVB Sensorimotor Task fMRI & T1-weighted image release004 datasets (request from www.cam-can.org).
- For R modelling:
- Download preprocessed data .csv's (www.osf.io/seuz5)
- For ROIs (definition/timeseries extraction) & multivariate procedures (MVB, MVPA):
cd freeSelection/aa_cc280_fingerTapping
run_aa
Standard SPM models can then be generated using matlab:
cd SMT/pp
wrapper
Ensure the necessary switches are set to false. e.g. If running from scratch:
done_setupDirs = true; /*switch to false if rerunningDuring the createROI.m routine, use SPM_results_ui to load data/groupGLM/SPM.mat. Next, select the peaks of brain activation in right and left motor cortex and create the binary masked Regions of Interest (ROIs):
createROI /*outputs: PreCG_R_70.nii,PreCG_L_70.nii etc.The convenience wrapper script (SMT/pp/wrapper.m) concludes by extracting beta estimates for single trials to single subject *.mat files.
For machine learning, follow the MVB functions/README via the SMT/MVB/ routine.
For MVPA (using SVM classification), follow the Matlab routine (freeSelection/pp/classify_run.m) which can be validated using an additional sk-learn Python routine (freeSelection/pp/classify.py)
The MVB sub-directories contains matlab code to create the data-tables for R analysis (SMT/MVB/doPostProcessing.m) though this post-processing script will fail to collect behavioural phenotype data (e.g. Reaction Times) unless your workstation is connected to the MRC CBU environment.
For convenience, the processed data-tables can be downloaded from the Open Science Framework (www.osf.io/seuz5).
Move these data.csv's to the appropriate csv directory (e.g. for the analysis reported in Figure 4, place the data.csv in SMT/MVB/R/70voxel_model-sparse/csv/data.csv).
In R, load the appropriate data.csv with SMT/MVB/R\<analysistype\>/<analysistype\>/run_001_loadData.R.
From there, any of the classical or Bayesian analyses can be performed using the dataframe: df.
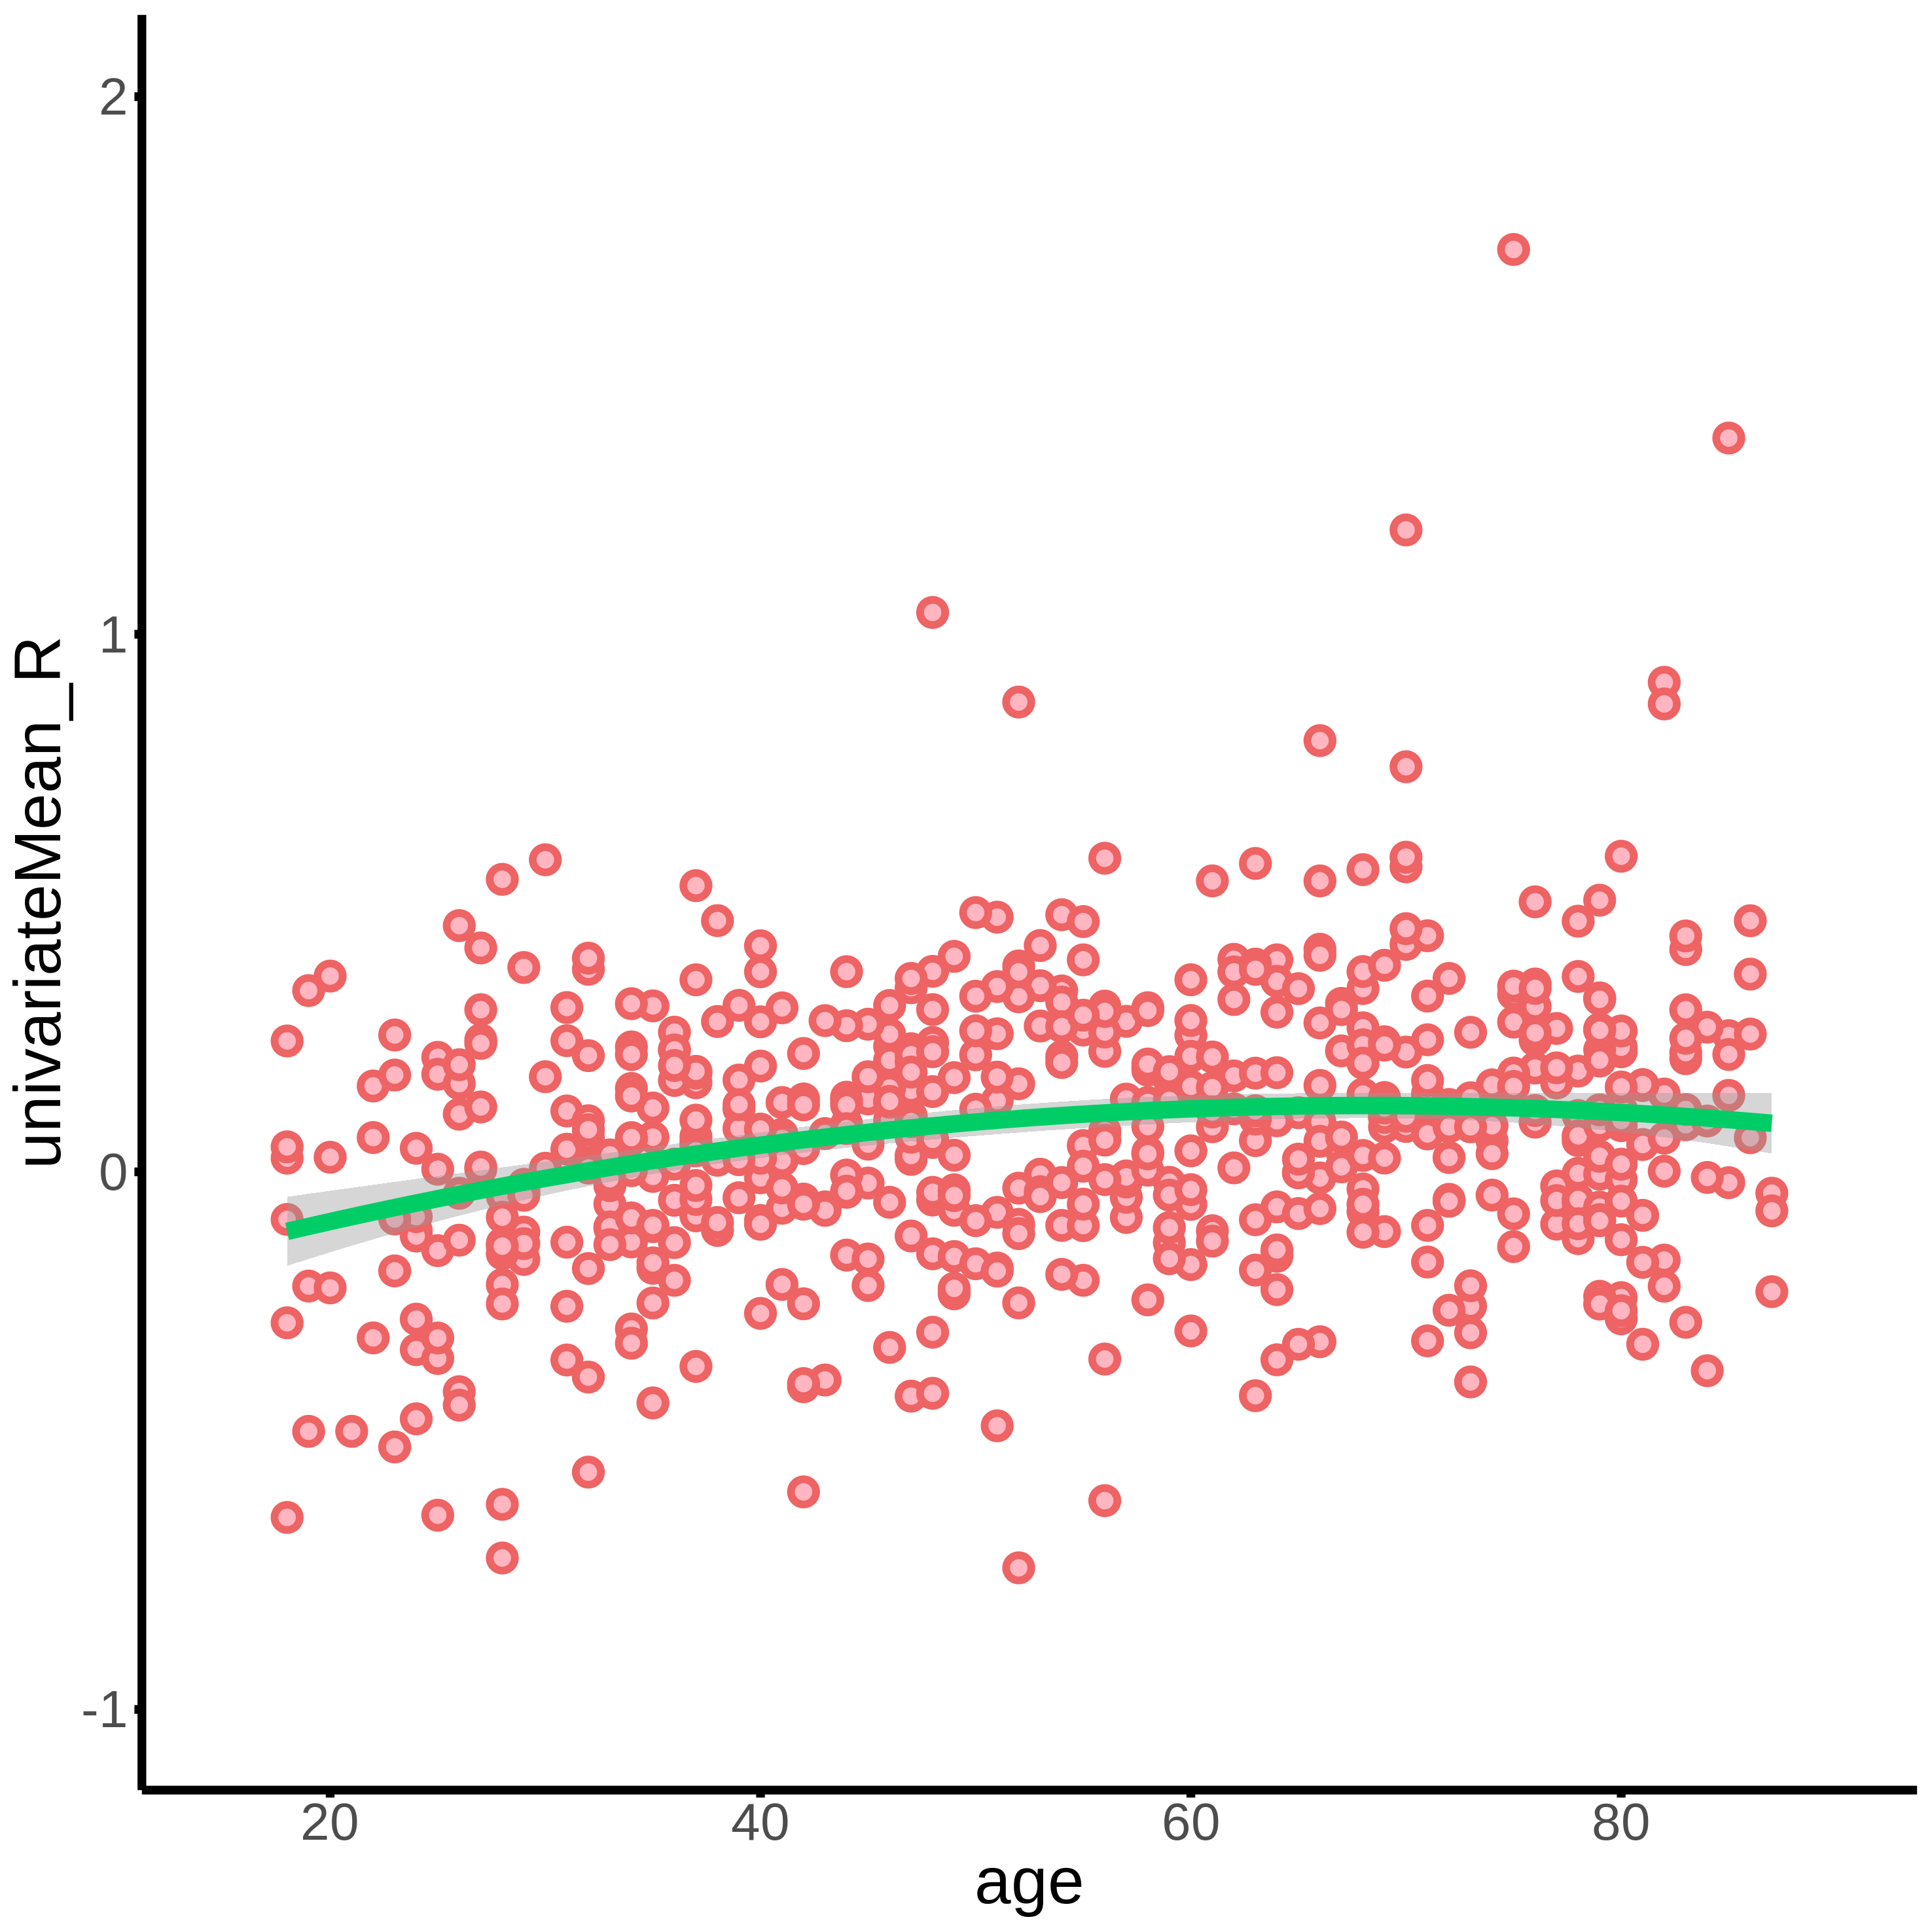
For example, to plot the hyperactivation of motor cortex in older adults:
setwd('HAROLD-MVB/tree/main/SMT/MVB/R')
source('run_fMRI_univariate.R')
#This boils down to writing a point ggplot based on the following robust linear regression model:
rlm_model <- rlm(univariateMean_R ~ age0z2,
                 data = df, psi = psi.huber, k = 1.345)