Centralized logging for Java applications with the Elastic stack made easy
Elastic Common Schema (ECS) defines a common set of fields for ingesting data into Elasticsearch. For more information about ECS, visit the ECS Reference Documentation.
This library helps to log ECS-compatible JSON into a file
Example:
{"@timestamp":"2019-08-06T12:09:12.375Z", "log.level": "INFO", "message":"Tomcat started on port(s): 8080 (http) with context path ''", "service.name":"spring-petclinic","process.thread.name":"restartedMain","log.logger":"org.springframework.boot.web.embedded.tomcat.TomcatWebServer"}
{"@timestamp":"2019-08-06T12:09:12.379Z", "log.level": "INFO", "message":"Started PetClinicApplication in 7.095 seconds (JVM running for 9.082)", "service.name":"spring-petclinic","process.thread.name":"restartedMain","log.logger":"org.springframework.samples.petclinic.PetClinicApplication"}
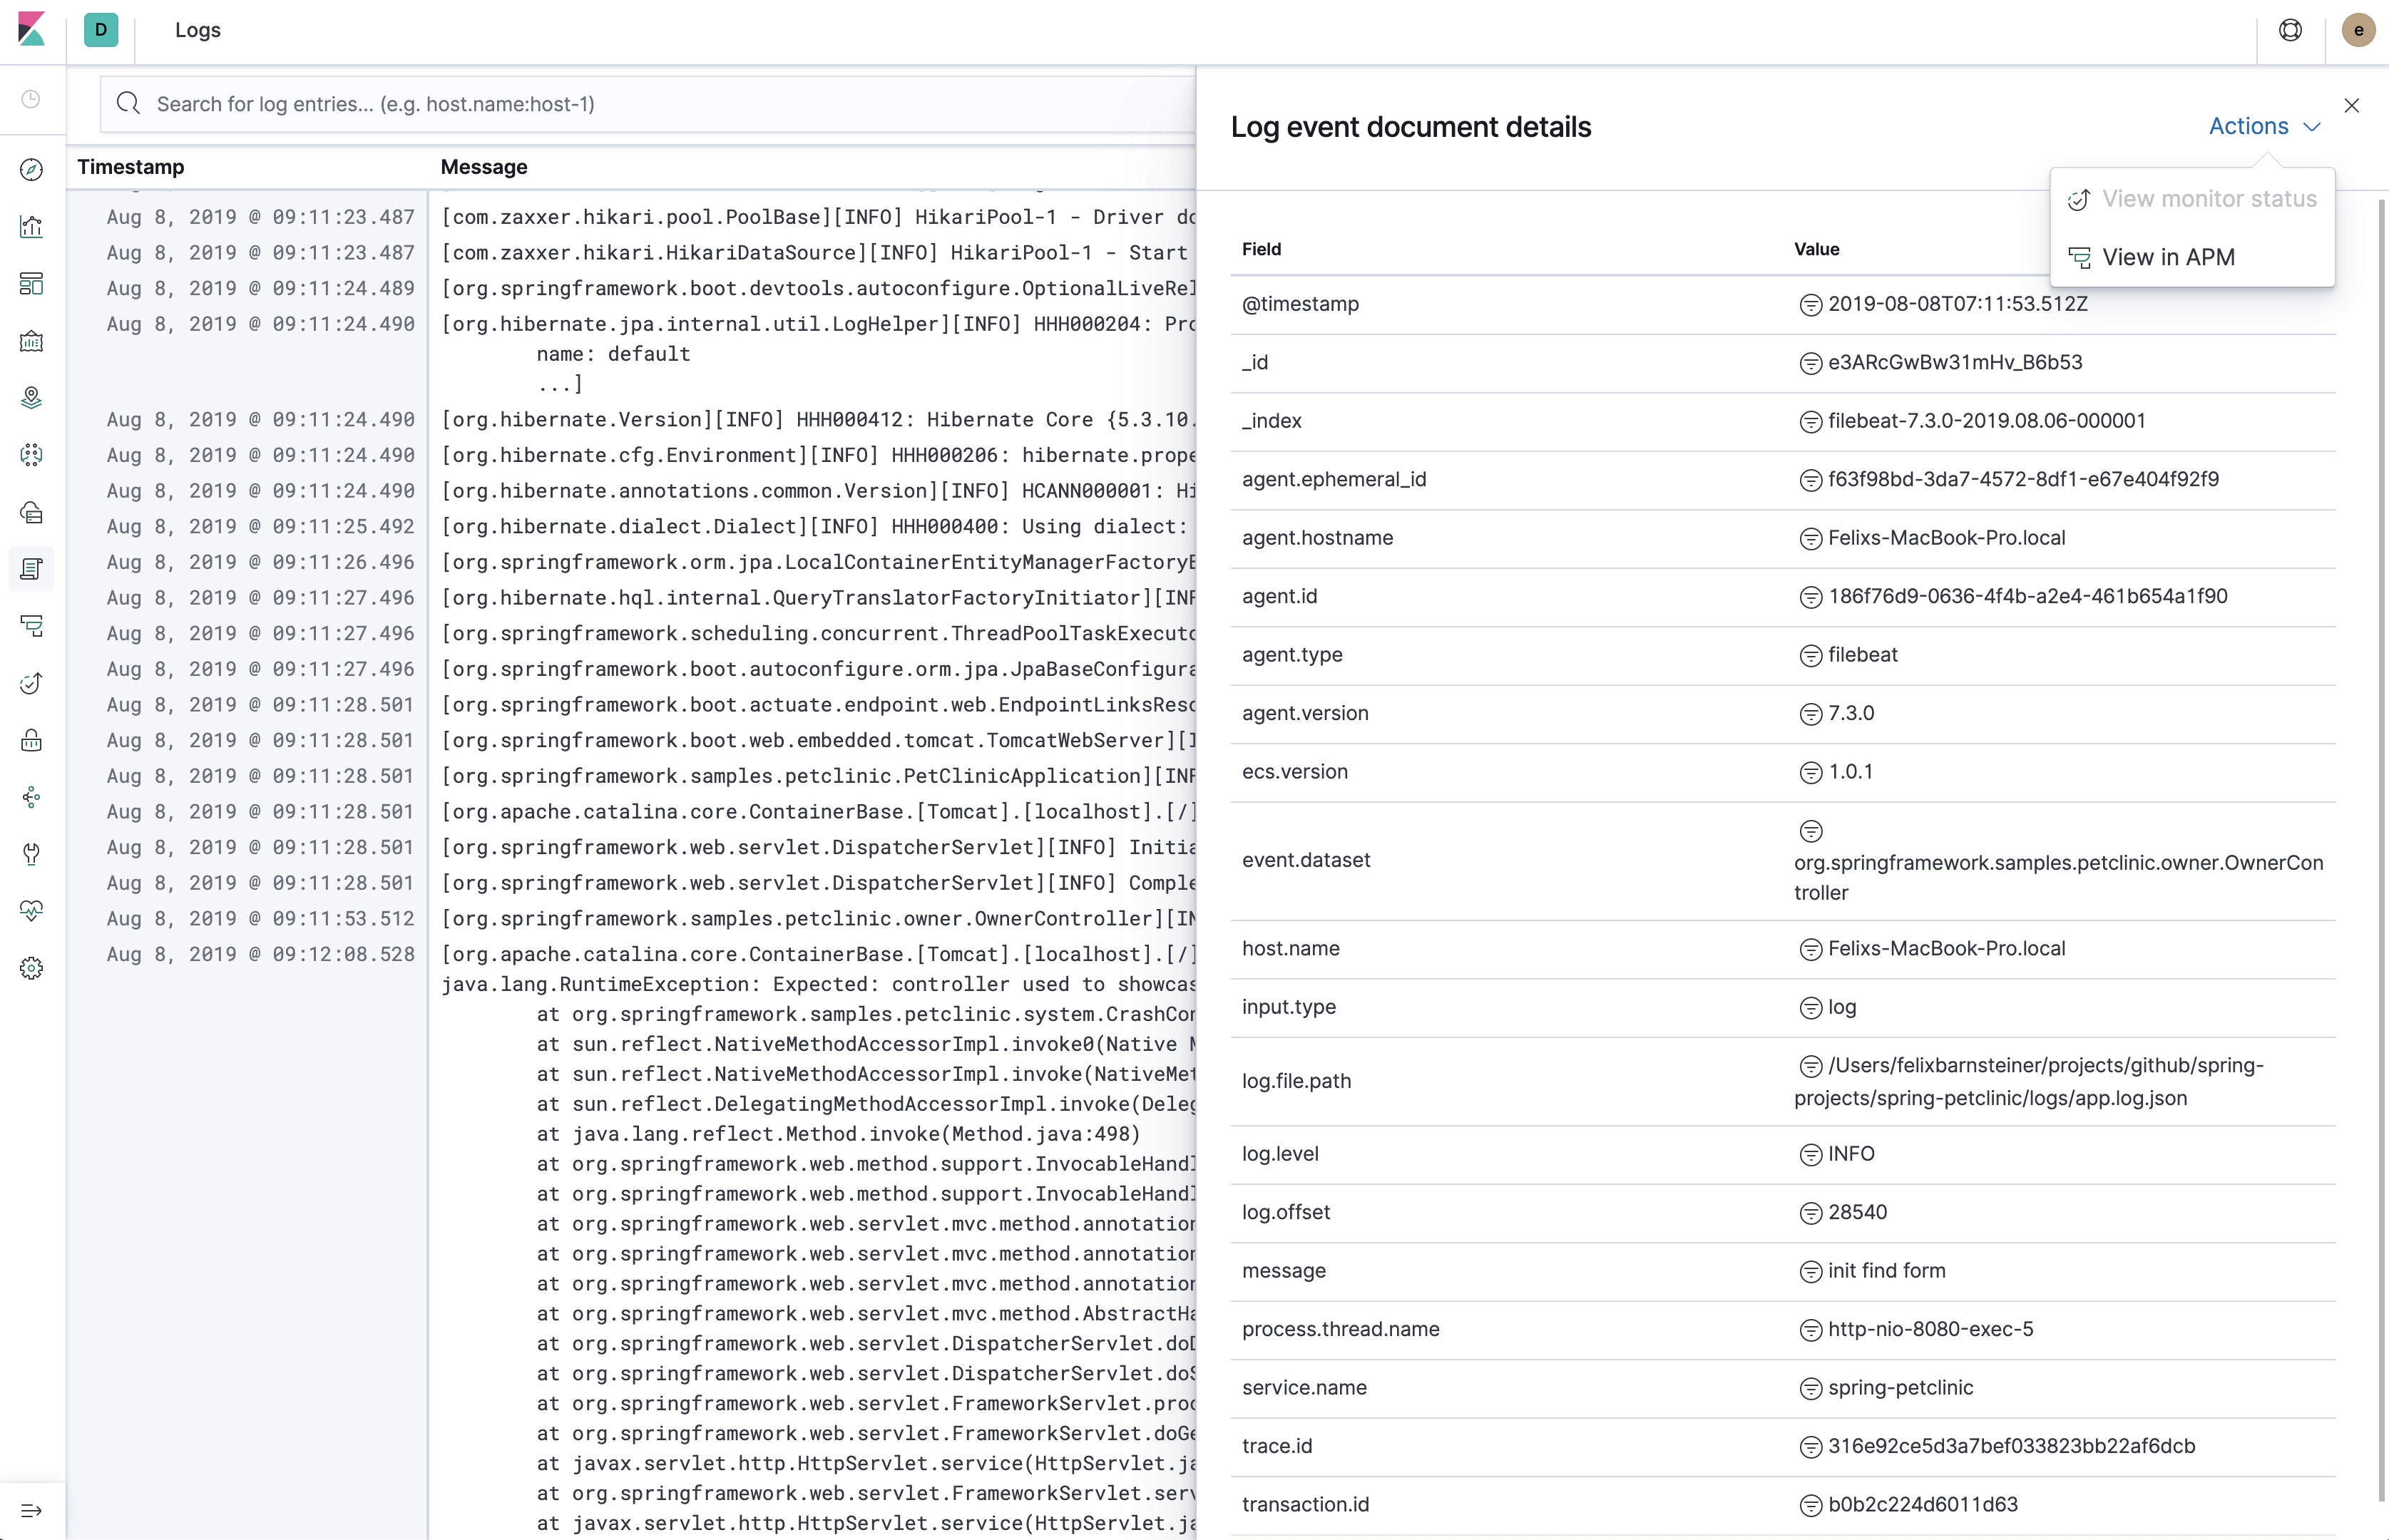
{"@timestamp":"2019-08-06T14:08:40.199Z", "log.level":"DEBUG", "message":"init find form", "service.name":"spring-petclinic","process.thread.name":"http-nio-8080-exec-8","log.logger":"org.springframework.samples.petclinic.owner.OwnerController","transaction.id":"28b7fb8d5aba51f1","trace.id":"2869b25b5469590610fea49ac04af7da"}
Logging in ECS-compatible JSON has the advantage that you don't need to set up a logstash/ingest node pipeline to parse logs using grok. Another benefit is that you are automatically using the field names the Logs UI expects, which means that getting started with it is straightforward.
If you are using the Elastic APM Java agent, you can leverage the log correlation feature without any additional configuration.
This lets you jump from the Span timeline in the APM UI to the Logs UI, showing only the logs which belong to the corresponding request. Vice versa, you can also jump from a log line in the Logs UI to the Span Timeline of the APM UI.
- No external dependencies
- Highly efficient by manually serializing JSON
- Low/Zero allocations (reduces GC pauses)
The log4j2EcsLayoutdoes not allocate any memory (unless the log event contains anException) - No parsing of the log file required
- Decently human-readable JSON structure
The first three fields are always@timestamp,log.levelandmessage. - Use the Kibana Logs UI without additional configuration
As this library adheres to ECS, the Logs UI knows which fields to show
We recommend using this library to log into a JSON log file and let Filebeat send the logs to Elasticsearch
- Resilient in case of outages
Guaranteed at-least-once delivery without buffering within the application, thus no risk ofOutOfMemoryErrors or lost events. There's also the option to use either the JSON logs or plain-text logs as a fallback. - Loose coupling
The application does not need to know the details of the logging backend (URI, credentials, etc.). You can also leverage alternative Filebeat outputs, like Logstash, Kafka or Redis. - Index Lifecycle management
Leverage Filebeat's default index lifemanagement settings. This is much more efficient than using daily indices. - Efficient Elasticsearch mappings
Leverage Filebeat's default ECS-compatible index template
filebeat.inputs:
- type: log
  paths: /path/to/logs.json
  json.keys_under_root: true

# no further processing required, logs can directly be sent to Elasticsearch
output.elasticsearch:
  hosts: ["https://localhost:9200"]

# Or to Elastic cloud
# Example:
#cloud.id: "staging:dXMtZWFzdC0xLmF3cy5mb3VuZC5pbyRjZWM2ZjI2MWE3NGJmMjRjZTMzYmI4ODExYjg0Mjk0ZiRjNmMyY2E2ZDA0MjI0OWFmMGNjN2Q3YTllOTYyNTc0Mw=="
#cloud.auth: "elastic:YOUR_PASSWORD"
For more information, check the Filebeat documentation
- Enroll the beat
In Kibana, go toManagement>Beats>Central Management>Enroll Beatsand follow the instructions. - Add a
Filebeat inputconfiguration block- Configure the path of the log file(s)
- Set
Other configtype: log json.keys_under_root: true
- Add an
Outputconfiguration block- Set
Output typetoElasticsearch - Configure the
hosts - For secured Elasticsearch deployments (like Elastic cloud) set
UsernameandPassword
- Set