-
Notifications
You must be signed in to change notification settings - Fork 1
Monitoring progress, output and error reporting
There are two ways to inspect the progress of a job.
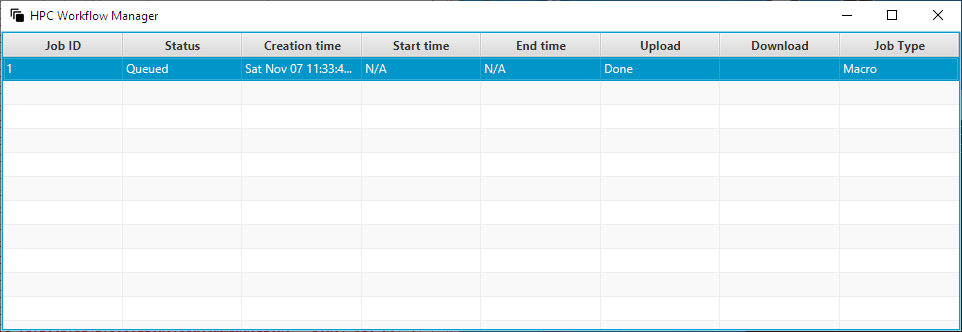
The first one is by looking at the “Status” of a job. This way you can see whether a job is running on the HPC cluster or not. In the case of the first figure, the job is “Queued”.

Job is queued.
However, this is a very coarse-grained way to see the progress of the job and when it starts running it does not provide any useful information until it has ended (“Finished”, “Failed” etc.).
The second way is to open the “Job dashboard” for the desired job by either double-clicking the job’s row or right-click and select the “Job dashboard” context menu item. Note that the job must be in the state “Running” for this functionality to work, you may open the window earlier and it will start displaying the progress when the state changes automatically.
Select the tab “Macro progress” and ignore the rest of the tabs for now (see section Job dashboard for descriptions of the rest of the tabs).
To view the progress, click on the “Macro progress” if it is not already selected (it should be selected by default). Please be patient while the progress is loading. There is a status bar in the lower right corner of the window where you can monitor the process of getting the progress from the HPC cluster (the progress is stored in a separate progress file for each compute-node of the HPC cluster it is run on).
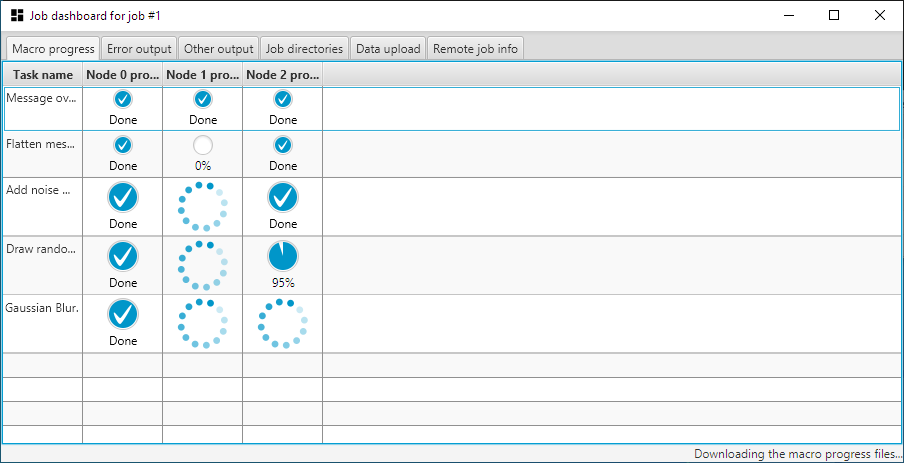
You can see a snapshot of the progress of the tasks of the running job of the example in the second figure.
Each line represents a different task, each column represents a different compute-node where the task is executed on, except the first column that provides task descriptions. Cells that do not have a progress indicator represent nodes that either will not execute the task at all or they have not started executing the task yet. In the second case, a progress indicator will appear when the progress is updated to zero percent (0%) or more.

The job is running and the progress indicators display the progress for each task on each compute-node.
In the “Job dashboard” there are the following five tabs:
- "Macro progress" – this tab is described in the previous section Inspecting progress (see example),
- "Error output" - the error output and warnings that are redirected live from the HPC cluster (see example),
- "Other output"- the live redirected standard output from the cluster in the tab (see example),
- "Job directories" – contains a listing of the job directories (Input, Output and Working) (see example),
- "Data upload" – contains a listing of the files that were uploaded (see example), and
- "Remote job info" – contains a display of the remote job information as well as the ability to preview the remote command (see example).
Short Guide Worksheets
-
Manually install cluster-side tools
- Note: The cluster-side tools are technically the Parallel Macro and OpenMPI Ops
-
Download and use your own cluster
- Note: A small homemade cluster for testing, or when you cannot access a big HPC
-
Building from scratch your own cluster and configuring it
- Note: You will learn and understand everything that's behind the scenes
- Additional Useful Information