-
Notifications
You must be signed in to change notification settings - Fork 27
Phantom Web Console
Devashish Shankar edited this page Aug 27, 2013
·
3 revisions
Phantom Web Console is available for monitoring and configuration purposes. It has two components: A dashboard and a configuration console. The default URL for the console is: http://localhost:8081/admin/dashboard
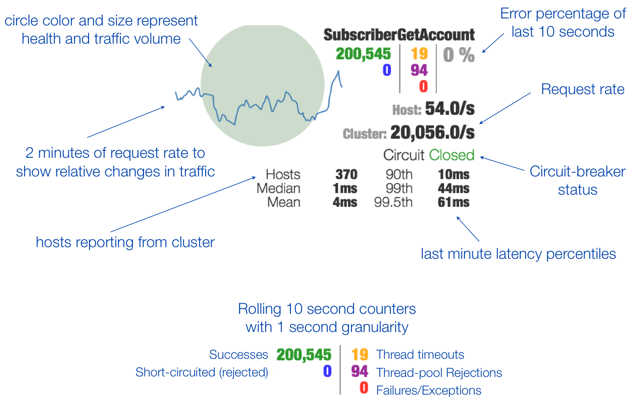
The dashboard is basically the Hystrix dashboard, and enables real time monitoring of your proxies. The dashboard shows the metrics of each command (defined in the TaskHandler) that is executed. It includes the QPS, various counters (success request count, thread pool request count, timed out request count, ... ), metrics on response time. It also shows whether the circuit is open or close.

A single command explained:

For more information, have a look at: https://github.com/Netflix/Hystrix/wiki/Dashboard