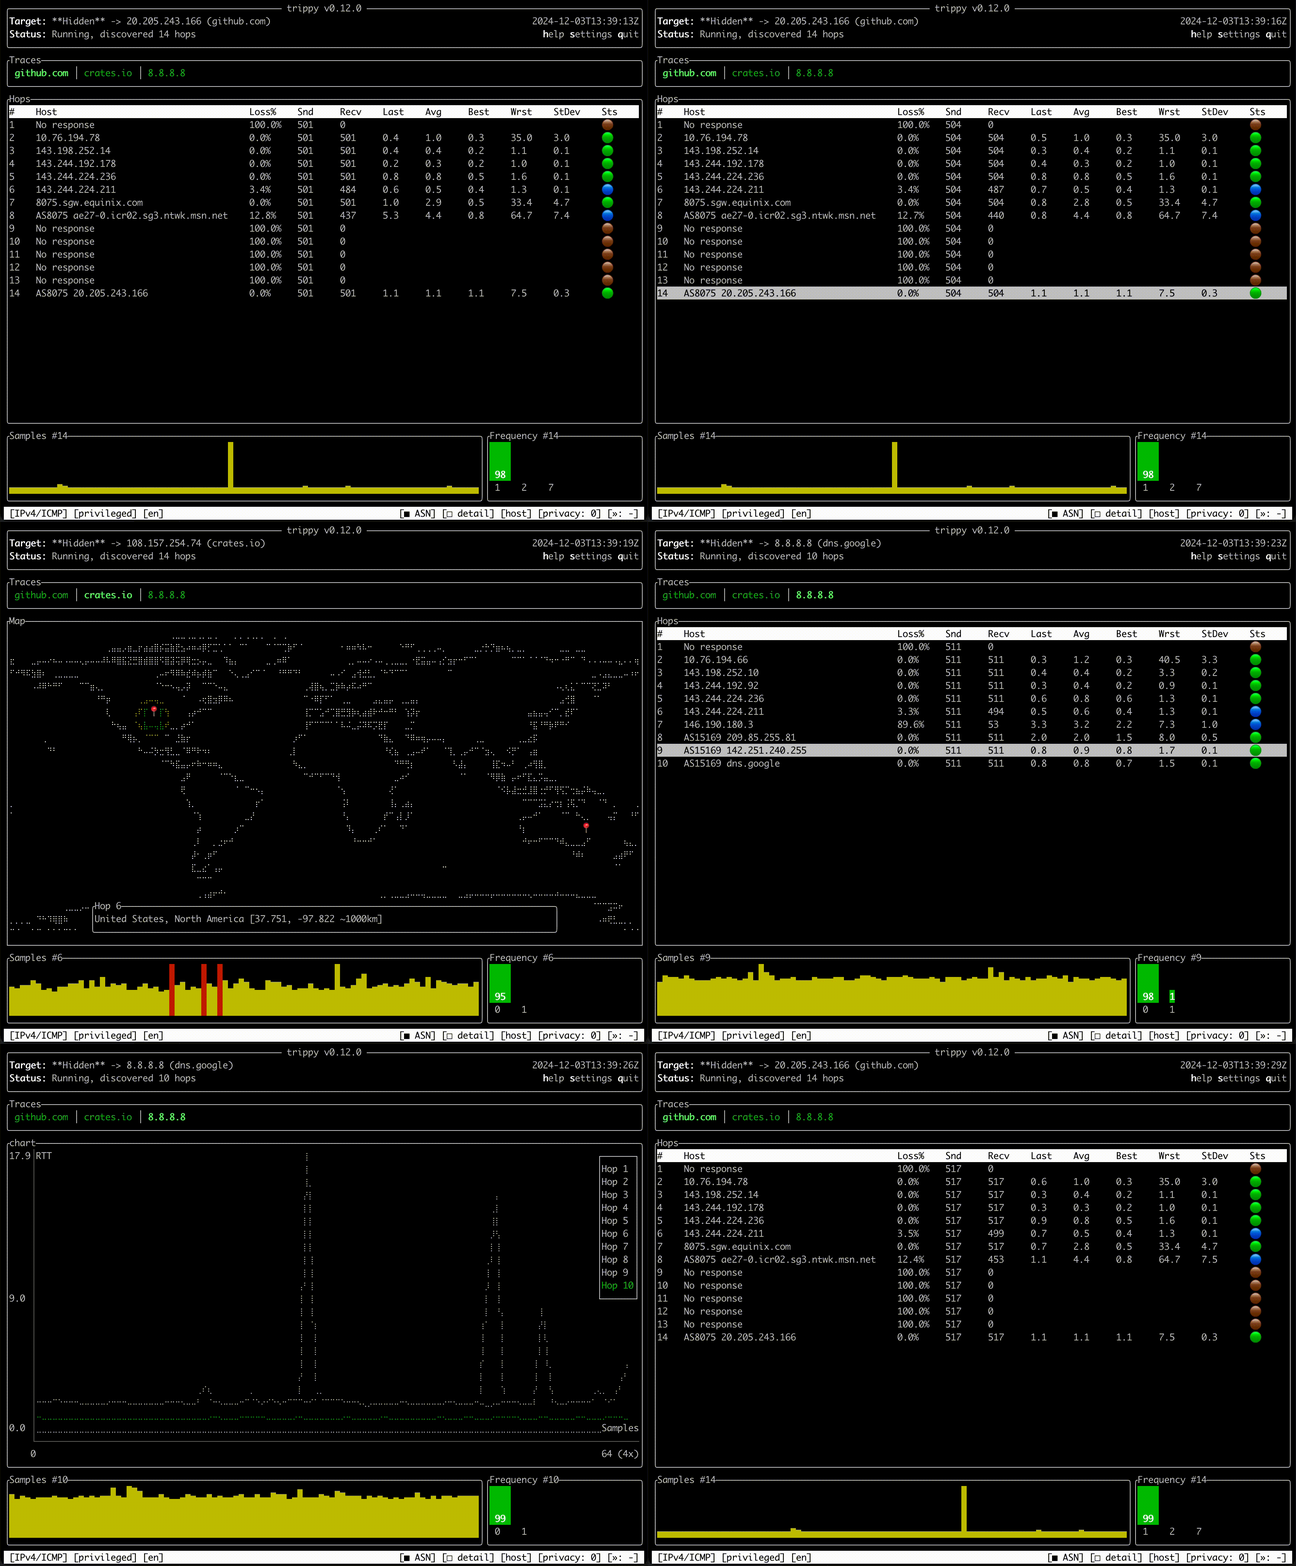
Trippy combines the functionality of traceroute and ping and is designed to assist with the analysis of networking issues.
Note
TUI translations - HELP NEEDED!
The next release of Trippy supports showing the TUI in a variety of languages and several translations have already
been added, including en
, fr
, tr
, zh
, pt
, sv
and it
.
Machine generated translations have been created for several other languages, including es
, de
, nl
, ko
, jp
,
hi
, ar
and ru
, but these need to be validated by a native speaker before they can be included.
If you are able to help validate translations for Trippy, or if you wish to add translations for any additional languages, please see the tracking issue for details of how to contribute.
Thank you for your help!
- Trace using multiple protocols:
ICMP
,UDP
&TCP
IPv4
&IPv6
- Customizable tracing options:
- packet size & payload pattern
- start and maximum time-to-live (TTL)
- minimum and maximum round duration
- round end grace period & maximum number of unknown hops
- source & destination port (
TCP
&UDP
) - source address and source interface
TOS
(akaDSCP + ECN
)
- Support for
classic
,paris
anddublin
Equal Cost Multi-path Routing strategies (tracking issue) - RFC4884 ICMP Multi-Part Messages
- Generic Extension Objects
- MPLS Label Stacks
- Unprivileged mode
- NAT detection
- Tui interface:
- Trace multiple targets simultaneously from a single instance of Trippy
- Per hop stats (sent, received, loss%, last, avg, best, worst, stddev, jitter & status)
- Per hop round-trip-time (RTT) history and frequency distributing charts
- Interactive chart of RTT for all hops in a trace with zooming capability
- Interactive GeoIp world map
- Isolate and filter by individual tracing flows
- Customizable color theme & key bindings
- Customizable column order and visibility
- Configuration via both command line arguments and a configuration file
- Show multiple hosts per hop with ability to cap display to N hosts and show frequency %
- Show hop details and navigate hosts within each hop
- Freeze/unfreeze the Tui, reset the stats, flush the cache, preserve screen on exit
- Responsive UI with adjustable refresh rate
- Hop privacy
- DNS:
- Use system, external (Google
8.8.8.8
or Cloudflare1.1.1.1
) or custom resolver - Lazy reverse DNS queries
- Lookup autonomous system number (ASN) and name
- Use system, external (Google
- GeoIp:
- Generate tracing reports:
json
,csv
& tabular (pretty-printed and markdown)- Tracing
flows
report - Graphviz
dot
charts - configurable reporting cycles
- Runs on multiple platform (macOS, Linux, Windows, NetBSD, FreeBSD, OpenBSD)
- Capabilities aware application (Linux only)
The following table lists ths versions of Trippy that are available and links to the corresponding release note and documentation:
Version | Release Date | Status | Release Note | Documentation |
---|---|---|---|---|
0.12.0-dev | n/a | Development | n/a | docs |
0.11.0 | 2024-08-11 | Current | note | docs |
0.10.0 | 2024-03-31 | Previous | note | docs |
0.9.0 | 2023-11-30 | Deprecated | note | docs |
0.8.0 | 2023-05-15 | Deprecated | note | docs |
0.7.0 | 2023-03-25 | Deprecated | note | docs |
0.6.0 | 2022-08-19 | Deprecated | note | docs |
Note
Only the latest patch versions of both the current and previous releases of Trippy are supported.
cargo install trippy --locked
sudo add-apt-repository ppa:fujiapple/trippy
sudo apt update && apt install trippy
snap install trippy
brew install trippy
winget install trippy
scoop install trippy
choco install trippy
pkgin install trippy
pkg install trippy
pkg_add trippy
pacman -S trippy
emerge -av net-analyzer/trippy
nix-env -iA trippy
docker run -it fujiapple/trippy
OS | Arch | Env | Current | Previous |
---|---|---|---|---|
Linux | x86_64 |
gnu |
0.11.0 | 0.10.0 |
Linux | x86_64 |
musl |
0.11.0 | 0.10.0 |
Linux | aarch64 |
gnu |
0.11.0 | 0.10.0 |
Linux | aarch64 |
musl |
0.11.0 | 0.10.0 |
Linux | arm7 |
gnueabihf |
0.11.0 | 0.10.0 |
Linux | arm7 |
musleabi |
0.11.0 | 0.10.0 |
Linux | arm7 |
musleabihf |
0.11.0 | 0.10.0 |
macOS | x86_64 |
darwin |
0.11.0 | 0.10.0 |
macOS | aarch64 |
darwin |
0.11.0 | 0.10.0 |
Windows | x86_64 |
msvc |
0.11.0 | 0.10.0 |
Windows | x86_64 |
gnu |
0.11.0 | 0.10.0 |
Windows | aarch64 |
msvc |
0.11.0 | 0.10.0 |
FreeBSD | x86_64 |
n/a | 0.11.0 | 0.10.0 |
NetBSD | x86_64 |
n/a | 0.11.0 | 0.10.0 |
RPM | x86_64 |
gnu |
0.11.0 | 0.10.0 |
Debian | x86_64 |
gnu |
0.11.0 | 0.10.0 |
Debian | x86_64 |
musl |
0.11.0 | 0.10.0 |
The following table lists the crates that are provided by Trippy. See crates for more information.
Crate | Description |
---|---|
trippy | A binary crate for the Trippy application and a library crate |
trippy-core | A library crate providing the core Trippy tracing functionality |
trippy-packet | A library crate which provides packet wire formats and packet parsing functionality |
trippy-dns | A library crate for performing forward and reverse lazy DNS resolution |
trippy-privilege | A library crate for discovering platform privileges |
trippy-tui | A library crate for the Trippy terminal user interface |
Trippy normally requires elevated privileges due to the use of raw sockets. Enabling the required privileges for your platform can be achieved in several ways, as outlined below. Trippy can also be used without elevated privileged on certain platforms, with some limitations.
1: Run as root
user via sudo
:
sudo trip example.com
2: chown
trip
as the root
user and set the setuid
bit:
sudo chown root $(which trip) && sudo chmod +s $(which trip)
3: [Linux only] Set the CAP_NET_RAW
capability:
sudo setcap CAP_NET_RAW+p $(which trip)
Note
Trippy is a capability aware application and will add CAP_NET_RAW
to the effective set if it is present in the
allowed set. Trippy will drop all capabilities after creating the raw sockets.
Trippy must be run with Administrator privileges on Windows.
Trippy allows running in an unprivileged mode for all tracing modes (ICMP
, UDP
and TCP
) on platforms which support
that feature.
Note
Unprivileged mode is currently only supported on macOS. Linux support is possible and may be added in the future.
Unprivileged mode is not supported on NetBSD, FreeBSD or Windows as these platforms do not support
the IPPROTO_ICMP
socket type. See #101 for further information.
The unprivileged mode can be enabled by adding the --unprivileged
(-u
) command line flag or by adding
the unprivileged
entry in the trippy
section of the configuration file:
[trippy]
unprivileged = true
Note
The paris
and dublin
ECMP
strategies are not supported in unprivileged mode as these require
manipulating the UDP
and IP
and headers which in turn requires the use of a raw socket.
Basic usage with default parameters:
trip example.com
Trace without requiring elevated privileges (supported platforms only, see privileges):
trip example.com --unprivileged
Trace using the udp
(or tcp
or icmp
) protocol (also aliases --icmp
, --udp
& --tcp
):
trip example.com -p udp
Trace to multiple targets simultaneously (icmp
protocol only,
see #72):
trip example.com google.com crates.io
Trace with a minimum round time of 250ms
and a grace period of 50ms
:
trip example.com -i 250ms -g 50ms
Trace with a custom first and maximum time-to-live
:
trip example.com --first-ttl 2 --max-ttl 10
Use custom destination port 443
for tcp
tracing:
trip example.com -p tcp -P 443
Use custom source port 5000
for udp
tracing:
trip example.com -p udp -S 5000
Use the dublin
(or paris
) ECMP routing strategy for udp
with fixed source and destination ports:
trip example.com -p udp -R dublin -S 5000 -P 3500
Trace with a custom source address:
trip example.com -p tcp -A 127.0.0.1
Trace with a source address determined by the IPv4 address for interface en0
:
trip example.com -p tcp -I en0
Trace using IPv6
:
trip example.com -6
Trace using ipv4-then-ipv6
fallback (or ipv6-then-ipv4
or ipv4
or ipv6
):
trip example.com --addr-family ipv4-then-ipv6
Generate a json
(or csv
, pretty
, markdown
) tracing report with 5 rounds of data:
trip example.com -m json -C 5
Generate a Graphviz DOT
file report of all tracing flows for a TCP trace after 5 rounds:
trip example.com --tcp -m dot -C 5
Generate a textual report of all tracing flows for a UDP trace after 5 rounds:
trip example.com --udp -m flows -C 5
Perform DNS queries using the google
DNS resolver (or cloudflare
, system
, resolv
):
trip example.com -r google
Lookup AS information for all discovered IP addresses (not yet available for the system
resolver,
see #66):
trip example.com -r google -z
Set the reverse DNS lookup cache time-to-live to be 60 seconds:
trip example.com --dns-ttl 60sec
Lookup and display short
(or long
or location
or off
) GeoIp information from a mmdb
file:
trip example.com --geoip-mmdb-file GeoLite2-City.mmdb --tui-geoip-mode short
Parse icmp
extensions:
trip example.com -e
Hide the IP address, hostname and GeoIp for the first two hops:
trip example.com --tui-privacy-max-ttl 2
Customize Tui columns (see Column Reference):
trip example.com --tui-custom-columns holsravbwdt
Customize the color theme:
trip example.com --tui-theme-colors bg-color=blue,text-color=ffff00
List all Tui items that can have a custom color theme:
trip --print-tui-theme-items
Customize the key bindings:
trip example.com --tui-key-bindings previous-hop=k,next-hop=j,quit=shift-q
List all Tui commands that can have a custom key binding:
trip --print-tui-binding-commands
Specify the location of the Trippy config file:
trip example.com --config-file /path/to/trippy.toml
Generate a template configuration file:
trip --print-config-template > trippy.toml
Generate bash
shell completions (or fish
, powershell
, zsh
, elvish
):
trip --generate bash
Generate ROFF
man page:
trip --generate-man
Run in silent
tracing mode and output compact
trace logging with full
span events:
trip example.com -m silent -v --log-format compact --log-span-events full
Note
Trippy command line arguments may be given in any order and my occur both before and after the targets.
A network diagnostic tool
Usage: trip [OPTIONS] [TARGETS]...
Arguments:
[TARGETS]...
A space delimited list of hostnames and IPs to trace
Options:
-c, --config-file <CONFIG_FILE>
Config file
-m, --mode <MODE>
Output mode [default: tui]
Possible values:
- tui: Display interactive TUI
- stream: Display a continuous stream of tracing data
- pretty: Generate a pretty text table report for N cycles
- markdown: Generate a Markdown text table report for N cycles
- csv: Generate a CSV report for N cycles
- json: Generate a JSON report for N cycles
- dot: Generate a Graphviz DOT file for N cycles
- flows: Display all flows for N cycles
- silent: Do not generate any tracing output for N cycles
-u, --unprivileged
Trace without requiring elevated privileges on supported platforms
[default: false]
-p, --protocol <PROTOCOL>
Tracing protocol [default: icmp]
Possible values:
- icmp: Internet Control Message Protocol
- udp: User Datagram Protocol
- tcp: Transmission Control Protocol
--udp
Trace using the UDP protocol
--tcp
Trace using the TCP protocol
--icmp
Trace using the ICMP protocol
-F, --addr-family <ADDR_FAMILY>
The address family [default: Ipv4thenIpv6]
Possible values:
- ipv4: Ipv4 only
- ipv6: Ipv6 only
- ipv6-then-ipv4: Ipv6 with a fallback to Ipv4
- ipv4-then-ipv6: Ipv4 with a fallback to Ipv6
-4, --ipv4
Use IPv4 only
-6, --ipv6
Use IPv6 only
-P, --target-port <TARGET_PORT>
The target port (TCP & UDP only) [default: 80]
-S, --source-port <SOURCE_PORT>
The source port (TCP & UDP only) [default: auto]
-A, --source-address <SOURCE_ADDRESS>
The source IP address [default: auto]
-I, --interface <INTERFACE>
The network interface [default: auto]
-i, --min-round-duration <MIN_ROUND_DURATION>
The minimum duration of every round [default: 1s]
-T, --max-round-duration <MAX_ROUND_DURATION>
The maximum duration of every round [default: 1s]
-g, --grace-duration <GRACE_DURATION>
The period of time to wait for additional ICMP responses after the
target has responded [default: 100ms]
--initial-sequence <INITIAL_SEQUENCE>
The initial sequence number [default: 33434]
-R, --multipath-strategy <MULTIPATH_STRATEGY>
The Equal-cost Multi-Path routing strategy (UDP only) [default:
classic]
Possible values:
- classic:
The src or dest port is used to store the sequence number
- paris:
The UDP `checksum` field is used to store the sequence number
- dublin:
The IP `identifier` field is used to store the sequence number
-U, --max-inflight <MAX_INFLIGHT>
The maximum number of in-flight ICMP echo requests [default: 24]
-f, --first-ttl <FIRST_TTL>
The TTL to start from [default: 1]
-t, --max-ttl <MAX_TTL>
The maximum number of TTL hops [default: 64]
--packet-size <PACKET_SIZE>
The size of IP packet to send (IP header + ICMP header + payload)
[default: 84]
--payload-pattern <PAYLOAD_PATTERN>
The repeating pattern in the payload of the ICMP packet [default: 0]
-Q, --tos <TOS>
The TOS (i.e. DSCP+ECN) IP header value (TCP and UDP only) [default: 0]
-e, --icmp-extensions
Parse ICMP extensions
--read-timeout <READ_TIMEOUT>
The socket read timeout [default: 10ms]
-r, --dns-resolve-method <DNS_RESOLVE_METHOD>
How to perform DNS queries [default: system]
Possible values:
- system: Resolve using the OS resolver
- resolv: Resolve using the `/etc/resolv.conf` DNS configuration
- google: Resolve using the Google `8.8.8.8` DNS service
- cloudflare: Resolve using the Cloudflare `1.1.1.1` DNS service
-y, --dns-resolve-all
Trace to all IPs resolved from DNS lookup [default: false]
--dns-timeout <DNS_TIMEOUT>
The maximum time to wait to perform DNS queries [default: 5s]
--dns-ttl <DNS_TTL>
The time-to-live (TTL) of DNS entries [default: 300s]
-z, --dns-lookup-as-info
Lookup autonomous system (AS) information during DNS queries [default:
false]
-s, --max-samples <MAX_SAMPLES>
The maximum number of samples to record per hop [default: 256]
--max-flows <MAX_FLOWS>
The maximum number of flows to record [default: 64]
-a, --tui-address-mode <TUI_ADDRESS_MODE>
How to render addresses [default: host]
Possible values:
- ip: Show IP address only
- host: Show reverse-lookup DNS hostname only
- both: Show both IP address and reverse-lookup DNS hostname
--tui-as-mode <TUI_AS_MODE>
How to render AS information [default: asn]
Possible values:
- asn: Show the ASN
- prefix: Display the AS prefix
- country-code: Display the country code
- registry: Display the registry name
- allocated: Display the allocated date
- name: Display the AS name
--tui-custom-columns <TUI_CUSTOM_COLUMNS>
Custom columns to be displayed in the TUI hops table [default:
holsravbwdt]
--tui-icmp-extension-mode <TUI_ICMP_EXTENSION_MODE>
How to render ICMP extensions [default: off]
Possible values:
- off: Do not show `icmp` extensions
- mpls: Show MPLS label(s) only
- full: Show full `icmp` extension data for all known extensions
- all: Show full `icmp` extension data for all classes
--tui-geoip-mode <TUI_GEOIP_MODE>
How to render GeoIp information [default: short]
Possible values:
- off: Do not display GeoIp data
- short: Show short format
- long: Show long format
- location: Show latitude and Longitude format
-M, --tui-max-addrs <TUI_MAX_ADDRS>
The maximum number of addresses to show per hop [default: auto]
--tui-preserve-screen
Preserve the screen on exit [default: false]
--tui-refresh-rate <TUI_REFRESH_RATE>
The Tui refresh rate [default: 100ms]
--tui-privacy-max-ttl <TUI_PRIVACY_MAX_TTL>
The maximum ttl of hops which will be masked for privacy [default: 0]
--tui-theme-colors <TUI_THEME_COLORS>
The TUI theme colors [item=color,item=color,..]
--print-tui-theme-items
Print all TUI theme items and exit
--tui-key-bindings <TUI_KEY_BINDINGS>
The TUI key bindings [command=key,command=key,..]
--print-tui-binding-commands
Print all TUI commands that can be bound and exit
-C, --report-cycles <REPORT_CYCLES>
The number of report cycles to run [default: 10]
-G, --geoip-mmdb-file <GEOIP_MMDB_FILE>
The supported MaxMind or IPinfo GeoIp mmdb file
--generate <GENERATE>
Generate shell completion
[possible values: bash, elvish, fish, powershell, zsh]
--generate-man
Generate ROFF man page
--print-config-template
Print a template toml config file and exit
--log-format <LOG_FORMAT>
The debug log format [default: pretty]
Possible values:
- compact: Display log data in a compact format
- pretty: Display log data in a pretty format
- json: Display log data in a json format
- chrome: Display log data in Chrome trace format
--log-filter <LOG_FILTER>
The debug log filter [default: trippy=debug]
--log-span-events <LOG_SPAN_EVENTS>
The debug log format [default: off]
Possible values:
- off: Do not display event spans
- active: Display enter and exit event spans
- full: Display all event spans
-v, --verbose
Enable verbose debug logging
-h, --help
Print help (see a summary with '-h')
-V, --version
Print version
The following table lists the default Tui color theme. These can be overridden with the --tui-theme-colors
command
line option or in the theme-colors
section of the configuration file.
Item | Description | Default |
---|---|---|
bg-color |
The default background color | Black |
border-color |
The default color of borders | Gray |
text-color |
The default color of text | Gray |
tab-text-color |
The color of the text in traces tabs | Green |
hops-table-header-bg-color |
The background color of the hops table header | White |
hops-table-header-text-color |
The color of text in the hops table header | Black |
hops-table-row-active-text-color |
The color of text of active rows in the hops table | Gray |
hops-table-row-inactive-text-color |
The color of text of inactive rows in the hops table | DarkGray |
hops-chart-selected-color |
The color of the selected series in the hops chart | Green |
hops-chart-unselected-color |
The color of the unselected series in the hops chart | Gray |
hops-chart-axis-color |
The color of the axis in the hops chart | DarkGray |
frequency-chart-bar-color |
The color of bars in the frequency chart | Green |
frequency-chart-text-color |
The color of text in the bars of the frequency chart | Gray |
flows-chart-bar-selected-color |
The color of the selected flow bar in the flows chart | Green |
flows-chart-bar-unselected-color |
The color of the unselected flow bar in the flows chart | DarkGray |
flows-chart-text-current-color |
The color of the current flow text in the flows chart | LightGreen |
flows-chart-text-non-current-color |
The color of the non-current flow text in the flows chart | White |
samples-chart-color |
The color of the samples chart | Yellow |
samples-chart-lost-color |
The color of the samples chart for lost probes | Red |
help-dialog-bg-color |
The background color of the help dialog | Blue |
help-dialog-text-color |
The color of the text in the help dialog | Gray |
settings-dialog-bg-color |
The background color of the settings dialog | blue |
settings-tab-text-color |
The color of the text in settings dialog tabs | green |
settings-table-header-text-color |
The color of text in the settings table header | black |
settings-table-header-bg-color |
The background color of the settings table header | white |
settings-table-row-text-color |
The color of text of rows in the settings table | gray |
map-world-color |
The color of the map world diagram | white |
map-radius-color |
The color of the map accuracy radius circle | yellow |
map-selected-color |
The color of the map selected item box | green |
map-info-panel-border-color |
The color of border of the map info panel | gray |
map-info-panel-bg-color |
The background color of the map info panel | black |
map-info-panel-text-color |
The color of text in the map info panel | gray |
The supported ANSI colors are:
Black
,Red
,Green
,Yellow
,Blue
,Magenta
,Cyan
,Gray
,DarkGray
,LightRed
,LightGreen
,LightYellow
,LightBlue
,LightMagenta
,LightCyan
,White
In addition, CSS named colors (i.e. SkyBlue) and raw hex values (i.e. ffffff) may be used but note that these are only supported on some platforms and terminals and may not render correctly elsewhere.
Color names are case-insensitive and may contain dashes.
The following table lists the default Tui command key bindings. These can be overridden with the --tui-key-bindings
command line option or in the bindings
section of the configuration file.
Command | Description | Default |
---|---|---|
toggle-help |
Toggle help | h |
toggle-help-alt |
Toggle help (alternative binding) | ? |
toggle-settings |
Toggle settings | s |
toggle-settings-tui |
Open settings (Tui tab) | 1 |
toggle-settings-trace |
Open settings (Trace tab) | 2 |
toggle-settings-dns |
Open settings (Dns tab) | 3 |
toggle-settings-geoip |
Open settings (GeoIp tab) | 4 |
toggle-settings-bindings |
Open settings (Bindings tab) | 5 |
toggle-settings-theme |
Open settings (Theme tab) | 6 |
toggle-settings-columns |
Open settings (Columns tab) | 7 |
next-hop |
Select next hop | down |
previous-hop |
Select previous hop | up |
next-trace |
Select next trace | right |
previous-trace |
Select previous trace | left |
next-hop-address |
Select next hop address | . |
previous-hop-address |
Select previous hop address | , |
address-mode-ip |
Show IP address only | i |
address-mode-host |
Show hostname only | n |
address-mode-both |
Show both IP address and hostname | b |
toggle-freeze |
Toggle freezing the display | ctrl+f |
toggle-chart |
Toggle the chart | c |
toggle-map |
Toggle the GeoIp map | m |
toggle-flows |
Toggle the flows | f |
expand-privacy |
Expand hop privacy | p |
contract-privacy |
Contract hop privacy | o |
expand-hosts |
Expand the hosts shown per hop | ] |
expand-hosts-max |
Expand the hosts shown per hop to the maximum | } |
contract-hosts |
Contract the hosts shown per hop | [ |
contract-hosts-min |
Contract the hosts shown per hop to the minimum | { |
chart-zoom-in |
Zoom in the chart | = |
chart-zoom-out |
Zoom out the chart | - |
clear-trace-data |
Clear all trace data | ctrl+r |
clear-dns-cache |
Flush the DNS cache | ctrl+k |
clear-selection |
Clear the current selection | esc |
toggle-as-info |
Toggle AS info display | z |
toggle-hop-details |
Toggle hop details | d |
quit |
Quit the application | q |
The supported modifiers are: shift
, ctrl
, alt
, super
, hyper
& meta
. Multiple modifiers may be specified, for
example ctrl+shift+b
.
The below table lists the columns that are available for display in the Tui. These can be overridden with the
--tui-custom-columns
command line option or in the tui-custom-columns
attribute in the tui
section of the
configuration file.
Column | Code | Description |
---|---|---|
# |
h |
The time-to-live (TTL) for the hop |
Host |
o |
The hostname(s) and IP address(s) for the host(s) for the hop May include AS info, GeoIp and ICMP extensions Shows full hop details in hop detail navigation mode |
Loss% |
l |
The packet loss % for the hop |
Snd |
s |
The number of probes sent for the hop |
Recv |
r |
The number of probe responses received for the hop |
Last |
a |
The round-trip-time (RTT) of the last probe for the hop |
Avg |
v |
The average RTT of all probes for the hop |
Best |
b |
The best RTT of all probes for the hop |
Wrst |
w |
The worst RTT of all probes for the hop |
StDev |
d |
The standard deviation of all probes for the hop |
Sts |
t |
The status for the hop: - 🟢 Healthy hop - 🔵 Non-target hop with packet loss (does not necessarily indicate a problem) - 🟤 Non-target hop is unresponsive (does not necessarily indicate a problem) - 🟡 Target hop with packet loss (likely indicates a problem) - 🔴 Target hop is unresponsive (likely indicates a problem) |
Jttr |
j |
The round-trip-time (RTT) difference between consecutive rounds for the hop |
Javg |
g |
The average jitter of all probes for the hop |
Jmax |
x |
The maximum jitter of all probes for the hop |
Jint |
i |
The smoothed jitter value of all probes for the hop |
Seq |
Q |
The sequence number for the last probe for the hop |
Sprt |
S |
The source port for the last probe for the hop |
Dprt |
P |
The destination port for the last probe for the hop |
Type |
T |
The icmp packet type for the last probe for the hop: - TE: TimeExceeded - ER: EchoReply - DU: DestinationUnreachable - NA: NotApplicable |
Code |
C |
The icmp packet code for the last probe for the hop |
Nat |
N |
The NAT detection status for the hop |
Fail |
f |
The number of probes which failed to send for the hop |
The default columns are holsravbwdt
.
Note
The columns will be shown in the order specified in the configuration.
Trippy can be configured with via command line arguments or an optional configuration file. If a given configuration item is specified in both the configuration file and via a command line argument then the latter will take precedence.
The configuration file location may be provided to Trippy via the -c
(--config-file
) argument. If not provided,
Trippy will attempt to locate a trippy.toml
or .trippy.toml
configuration file in one of the following locations:
- The current directory
- The user home directory
- the XDG config directory (Unix only):
$XDG_CONFIG_HOME
or~/.config
- the Windows data directory (Windows only):
%APPDATA%
An annotated template configuration file is available for 0.9.0, 0.10.0 and 0.11.0.
Trippy (version 0.9.0
or later) can generate a template configuration file:
trip --print-config-template > trippy.toml
Important
If you are using Windows you must configure the Windows Defender firewall to allow incoming ICMP traffic
When Trippy shows “Awaiting data...” it means that it has received zero responses for the probes sent in a trace. This indicates that either probes are not being sent or, more typically, responses are not being received.
Check that local and network firewalls allow ICMP traffic and that the system traceroute
(or tracert.exe
on
Windows) works as expected. Note that on Windows, even if tracert.exe
works as expected, you
must configure the Windows Defender
firewall to allow incoming ICMP traffic.
For deeper diagnostics you can run tools such as https://www.wireshark.org and https://www.tcpdump.org to verify that icmp requests and responses are being send and received.
The Windows Defender firewall rule can be created using PowerShell.
New-NetFirewallRule -DisplayName "ICMPv4 Trippy Allow" -Name ICMPv4_TRIPPY_ALLOW -Protocol ICMPv4 -Action Allow
New-NetFirewallRule -DisplayName "ICMPv6 Trippy Allow" -Name ICMPv6_TRIPPY_ALLOW -Protocol ICMPv6 -Action Allow
The rules can be enabled as follows:
Enable-NetFirewallRule ICMPv4_TRIPPY_ALLOW
Enable-NetFirewallRule ICMPv6_TRIPPY_ALLOW
The rules can be disabled as follows:
Disable-NetFirewallRule ICMPv4_TRIPPY_ALLOW
Disable-NetFirewallRule ICMPv6_TRIPPY_ALLOW
The Windows Defender firewall rule may also be configured manually, see here for a step-by-step guide.
There are no specific recommended settings for Trippy, it provides a variety of configurable features which can be used to perform different types of analysis. The choice of settings will depend on the analysis you wish to perform and the environment in which you are working.
The following lists some common options along with some some basic guidance on when they might be appropriate.
Note
The Windows tracert
tool uses ICMP by default, whereas most Unix traceroute
tools use UDP by default.
By default Trippy will run an ICMP trace to the target. This will typically produce a consistent path to the target (a single flow) for each round of tracing which makes it easy to read and analyse. This is a useful mode for general network troubleshooting.
However, many routers are configured to rate-limit ICMP traffic which can make it difficult to get an accurate picture of packet loss. In addition, ICMP traffic is not typically subject to ECMP routing and so may not reflect the path that would taken by other protocols such as UDP and TCP.
To run a simple ICMP trace:
trip example.com
Due to the rate-limiting of ICMP traffic, some people prefer to hide the Loss%
and Recv
columns in the Tui as
these are easy to misinterpret.
trip example.com --tui-custom-columns hosavbwdt
These settings can be made permanent by adding them to the Trippy configuration file:
[tui]
custom-columns = "hosavbwdt"
Note
The Sts
column shows different color codes to reflect packet loss at intermediate vs the target hop, see the
Column Reference for more information.
UDP tracing provides a more realistic view of the path taken by traffic that is subject to ECMP routing.
Setting a fixed target port in the range 33434-33534 may allow Trippy to determine that the probe has reached the target as many routers and firewalls are configured to allow UDP probes in that range and will respond with a Destination Unreachable response.
However, running a UDP trace with a fixed target port and a variable source port will typically result in different paths being followed for each probe within each round of tracing. This can make it difficult to interpret the output as different hosts will reply for a given hop (time-to-live) across rounds.
By using the dublin
ECMP strategy, which encodes the sequence number in the IP identifier
field, Trippy can fix both
the source and target ports, typically resulting in a single path for each probe within each round of tracing.
Note
UDP/Dublin for IPv6 encodes the sequence number as the payload length as the IP identifier
field is not available in
IPv6.
Note
Keep in mind that every probe is an independent trial and each may traverse a completely different path. In practice, ICMP probes often follow a single path, whereas the path of UDP and TCP probes is typically determined by the 5-tuple of protocol, source and destination IP addresses and ports.
Also beware that the return path may not be the same as the forward path, and may also differ for each probe.
Strategies such as dublin
and paris
assist in controlling the path taken by the forward probes, but do not help
control the return path. Therefore it is recommended to run a trace in both directions to get a complete picture.
To run a UDP trace with fixed source and target ports using the dublin
ECMP strategy:
trip example.com --udp --multipath-strategy dublin --source-port 5000 --target-port 33434
Note
The source port can be any valid port number, but the target port should usually be in the range 33434-33534 or whatever range is open to UDP probes on the target host.
These settings can be made permanent by adding them to the Trippy configuration file:
[strategy]
protocol = "udp"
multipath-strategy = "dublin"
source-port = 5000
target-port = 33434
As an extension to the above, if you do not fix the source port when using the dublin
ECMP strategy, Trippy will
vary the source port per round of tracing (i.e. each probe within a given round will share the same source port, and
the source port will vary for each round). This will typically result in the same path being followed for each probe
within a given round, but different paths being followed for each round.
These individual flows can be explored in the Trippy Tui by pressing the toggle-flows
key binding (f
key by
default).
Adding the columns Seq
, Sprt
and Dprt
to the Tui will show the sequence number, source port and destination port
respectively which makes this easier to visualize.
trip example.com --udp --multipath-strategy dublin --target-port 33434 --tui-custom-columns holsravbwdtSPQ
These settings can be made permanent by adding them to the Trippy configuration file:
[strategy]
protocol = "udp"
multipath-strategy = "dublin"
target-port = 33434
[tui]
custom-columns = "holsravbwdtSPQ"
To make the flows easier to visualize, you can generate a Graphviz DOT file report of all tracing flows:
trip example.com --udp --multipath-strategy dublin --target-port 33434 -m dot -C 5
UDP with the paris
ECMP strategy offers the same benefits as the dublin
strategy with fixed ports and can be used
in the same way.
They differ in the way they encode the sequence number in the probe. The dublin
strategy uses the IP identifier
field, whereas the paris
strategy uses the UDP checksum
field.
To run a UDP trace with fixed source and target ports using the paris
ECMP strategy:
trip example.com --udp --multipath-strategy paris --source-port 5000 --target-port 33434
The paris
strategy does not work behind NAT as the UDP checksum
field is typically modified by NAT devices.
Therefore the dublin
strategy is recommended when NAT is present.
Note
Trippy can detect the presence of NAT devices in some circumstances when using the dublin
strategy and the Nat
column can be shown in the Tui to indicate when NAT is detected. See the Column Reference for
more information.
TCP tracing is similar to UDP tracing in that it provides a more realistic view of the path taken by traffic that is subject to ECMP routing.
TCP tracing defaults to using a target port of 80 and sets the source port as the sequence number which will typically result in a different path being followed for each probe within each round of tracing.
To run a TCP trace:
trip example.com --tcp
TCP tracing is useful for diagnosing issues with TCP connections and higher layer protocols such as HTTP. Often UDP tracing can be used in place of TCP to diagnose IP layer network issues and, as it provides ways to control the path taken by the probes, it is often preferred.
Note
Trippy does not support the dublin
or paris
ECMP strategies for TCP tracing and so you cannot fix both the source
and target ports. See the tracking issue for details.
Trippy is made possible by ratatui ( formerly tui-rs), crossterm as well as several foundational Rust libraries.
Trippy draws heavily from mtr and also incorporates ideas from both libparistraceroute & Dublin Traceroute.
The Trippy networking code is inspired by pnet and some elements of that codebase are incorporated in Trippy.
The AS data is retrieved from the IP to ASN Mapping Service provided by Team Cymru.
The trippy.cli.rs CNAME hosting is provided by cli.rs.
The Trippy chat room is sponsored by Zulip.
This project is distributed under the terms of the Apache License (Version 2.0).
Unless you explicitly state otherwise, any contribution intentionally submitted for inclusion in time by you, as defined in the Apache-2.0 license, shall be licensed as above, without any additional terms or conditions.
See LICENSE for details.
Copyright 2022 Trippy Contributors