最近因為 「新冠肺炎」 大家都在煩惱買不到口罩
為了因應民眾需求,政府在 2/7 開放了 「健保特約機構口罩剩餘數量明細清單」
因此現在網路上可以看到很多熱心的工程師大大製作的口罩庫存地圖
方便大家購買前可以先查詢庫存數量,避免白跑一趟
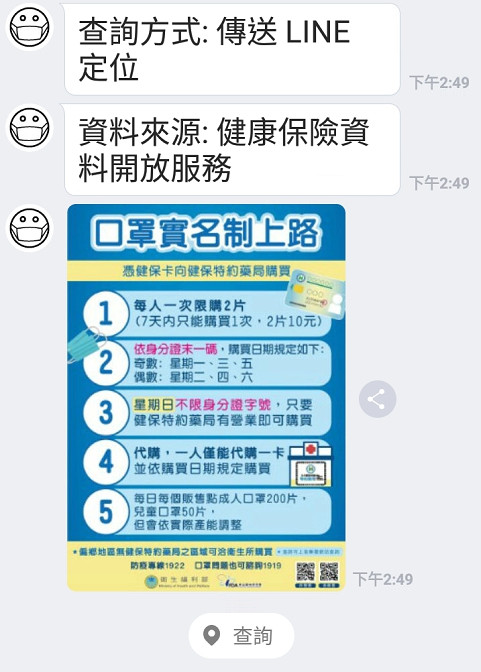
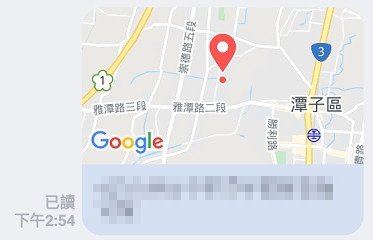
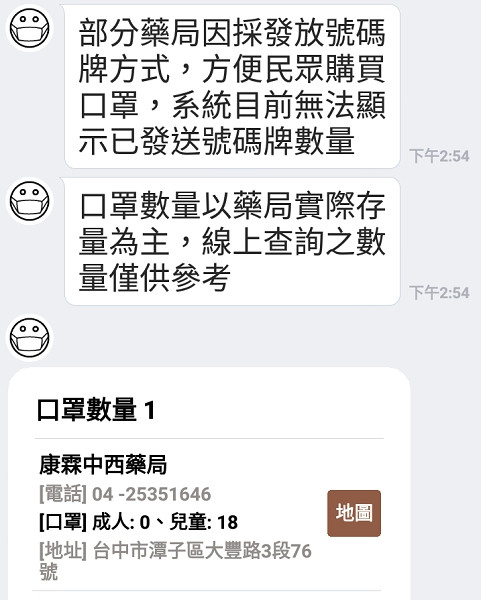
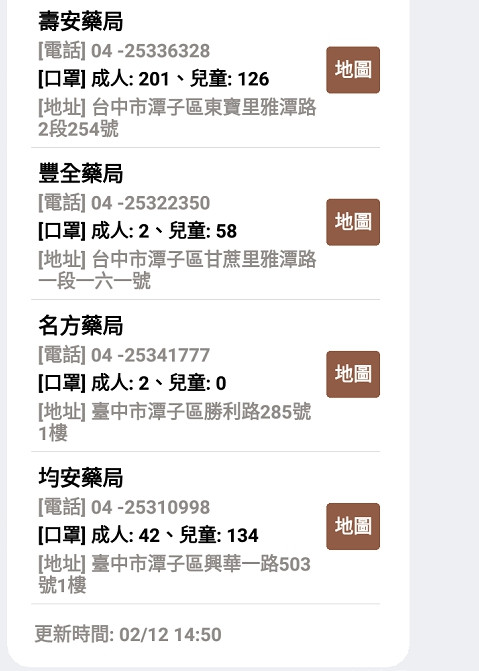
小弟也用 LINE Bot 做了類似的服務 「口罩機器人」
今天就來和大家分享製作心得
主要分成兩個部分。
- 抓取口罩庫存資訊
- LINE Bot 查詢附近藥局
資料可以透過 「健康保險資料開放服務」 取得。
-
藥局資訊:
健保特約醫事機構-藥局 -
口罩數量:
健保特約機構口罩剩餘數量明細清單
不過下載後發現資料沒有提供經緯度,處理起來有點麻煩,所以放棄此法。
可以使用 Google Map API 轉換,需要收費
後來在某 FB 社團,找到已經轉好經緯度的資料,由 kiang 大提供。
https://raw.githubusercontent.com/kiang/pharmacies/master/json/points.json
資料格式為 JSON,且已將藥局資訊和口罩數量合併,可以直接使用。
這部分本來使用爬蟲定時將資料爬回資料庫,LINE Bot 在透過資料庫查詢,但後來發現這樣效能很差,因為資料更新的頻率太高。
思考後,決定改用快取,資料都在記憶體內,過期就釋放掉,雖然沒有了資料歷程,但節省了很多資源。
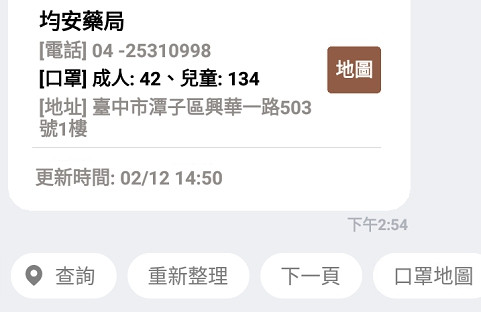
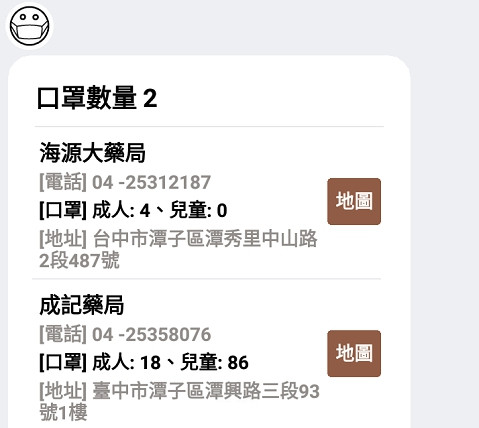
先給大家看看結果。
這部分很簡單,使用 HttpClient 呼叫 API 然後將結果轉成物件回傳。
private async Task<FeatureCollection> loadJson()
{
    using (var httpClient = new HttpClient())
    {
        var json = await httpClient.GetStringAsync(
            "https://raw.githubusercontent.com/kiang/pharmacies/master/json/points.json");
        return JsonConvert.DeserializeObject<FeatureCollection>(json);
    }
}取得資料後寫入記憶體快取,並設定有效時間為 30 秒。
快取需要使用 lock 關鍵字,並在前後各判斷一次
val == null,才能確保只呼叫一次 API,不會有多人爭搶的情況發生。
private static object locker = new object();
public FeatureCollection GetJson()
{
    var cacheName = "Json";

    var val = _memoryCache.Get<FeatureCollection>(cacheName);

    if (val == null)
    {
        lock (locker)
        {
            val = _memoryCache.Get<FeatureCollection>(cacheName);

            if (val == null)
            {
                var json = loadJson()
                    .ConfigureAwait(false).GetAwaiter().GetResult();

                val = json;

                _memoryCache.Set(cacheName, val, new MemoryCacheEntryOptions
                {
                    //30秒後過期
                    AbsoluteExpiration = DateTimeOffset.Now.AddSeconds(30)
                });
            }
        }
    }
    return val;
}
3. 使用 Haversine 公式計算距離
這裡就不探討數學,知道它可以用來計算經緯度距離就可以。
//計算兩點間的距離
private double Haversine(double lat1, double long1, double lat2, doublelong2)
{
    var R = 6371;

    double rad(double x)
    {
        return x * Math.PI / 180;
    }

    var dLat = rad(lat2 - lat1);

    var dLong = rad(long2 - long1);

    var a = Math.Sin(dLat / 2) * Math.Sin(dLat / 2) +
            Math.Cos(rad(lat1)) * Math.Cos(rad(lat2)) *
            Math.Sin(dLong / 2) * Math.Sin(dLong / 2);

    var c = 2 * Math.Atan2(Math.Sqrt(a), Math.Sqrt(1 - a));

    var d = R * c;

    return d;
}private List<Feature> GetRankList(
decimal latitude, decimal longitude, int skip)
{
var json = _cacheService.GetJson();
var dataList = json.features;
var rankList = dataList
.Select(it => new
{
rank = Haversine(
(double)it.geometry.coordinates[1],
(double)it.geometry.coordinates[0],
(double)latitude,
(double)longitude),
data = it
})
.OrderBy(it => it.rank)
.Skip(skip).Take(5)
.Select(it => it.data)
.ToList();
return rankList;
}var rankList = GetRankList(
locationMessage.Latitude,
locationMessage.Longitude, skip);
var flexMessage = GetFlexMessage(rankList);
await _messagingClient.ReplyMessageAsync(ev.ReplyToken,
new List<ISendMessage> { flexMessage });[2020/02/12 更新]
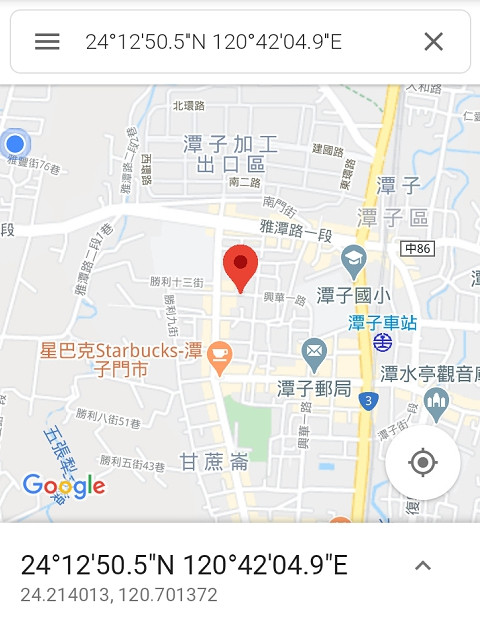
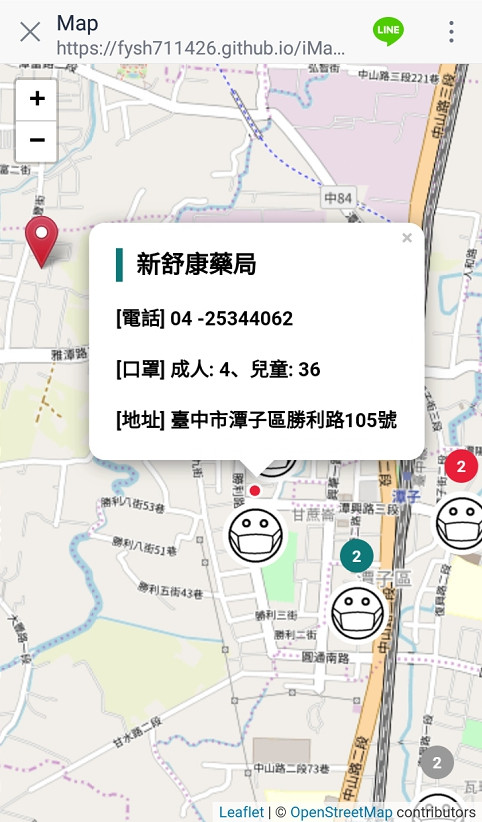
這是新功能,可以在地圖上查看附近藥局資訊。
會做這個是因為看了,六角學院校長的教學影片,覺得還蠻有趣的
https://www.youtube.com/watch?v=pUizu62dlnY
裡面使用的是免費地圖 「OpenStreetMap + Leaflet」
不怕收到 60萬帳單
有在關注口罩資訊的朋友,應該都聽過 「6小時收到 60萬帳單」 這件事吧 ~~~
好想工作室的 Howard 大,製作的超商口罩地圖,上線 6小時收到 60萬帳單
趁這個機會熟悉一下地圖用法
╰( ̄▽ ̄)╭
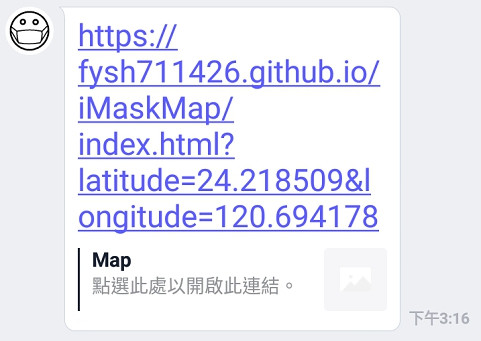
快速回覆 Quick Reply 不能開啟網址,所以需要多這個步驟。
引用 leaflet,並初始化地圖。
- HTML
<div id="map"></div>- JS
//設定地圖中心座標和縮放比例
var map = L.map('map', {
    center: [latitude, longitude],
    zoom: 12
});

//載入 OpenStreetMap 地圖資訊
L.tileLayer('https://{s}.tile.openstreetmap.org/{z}/{x}/{y}.png', {
    attribution: '© <a href="https://www.openstreetmap.org/copyright">OpenStreetMap</a> contributors'
}).addTo(map);

var redIcon = new L.Icon({
    iconUrl: 'https://cdn.rawgit.com/pointhi/leaflet-color-markers/master/img/marker-icon-2x-red.png',
    shadowUrl: 'https://cdnjs.cloudflare.com/ajax/libs/leaflet/0.7.7/images/marker-shadow.png',
    iconSize: [25, 41],
    iconAnchor: [12, 41],
    popupAnchor: [1, -34],
    shadowSize: [41, 41]
});

//在中心座標,放上紅色定位圖標
L.marker([latitude, longitude], { icon: redIcon }).addTo(map);
圖標 GitHub 連結: https://github.com/pointhi/leaflet-color-markers
我會根據成人口罩數量,將藥局分為 4 個顏色。
- 綠色: 50 以上
- 橘色: 21~49
- 紅色: 1~20
- 灰色: 售完
var xhr = new XMLHttpRequest();
xhr.open('get', 'https://raw.githubusercontent.com/kiang/pharmacies/master/json/points.json');
xhr.send();
xhr.onload = function () {
    var data = JSON.parse(xhr.responseText).features;
    for (var i = 0; i < data.length; i++) {

        //將藥局標記不同顏色的圖標
        var imageIcon = image0Icon;
        if (data[i].properties.mask_adult >= 50)
            imageIcon = image3Icon;
        else if (data[i].properties.mask_adult > 20)
            imageIcon = image2Icon;
        else if (data[i].properties.mask_adult > 0)
            imageIcon = image1Icon;

        //設定藥局經緯度和 Popup 內容
        var mark = L.marker([
            data[i].geometry.coordinates[1],
            data[i].geometry.coordinates[0]
        ], { icon: imageIcon }
        ).bindPopup(
            '<p class="popup-name">' +
                data[i].properties.name + '<p/>' +
            '<p class="popup-phone">[電話] ' +
                data[i].properties.phone + '<p/>' +
            '<p class="popup-mask">[口罩] 成人: ' +
                data[i].properties.mask_adult + '、兒童: ' +
                data[i].properties.mask_child + '<p/>' +
            '<p class="popup-address">[地址] ' +
                data[i].properties.address + '<p/>');

        //將圖標加入圖層
        markers.addLayer(mark);
    }
    map.addLayer(markers);
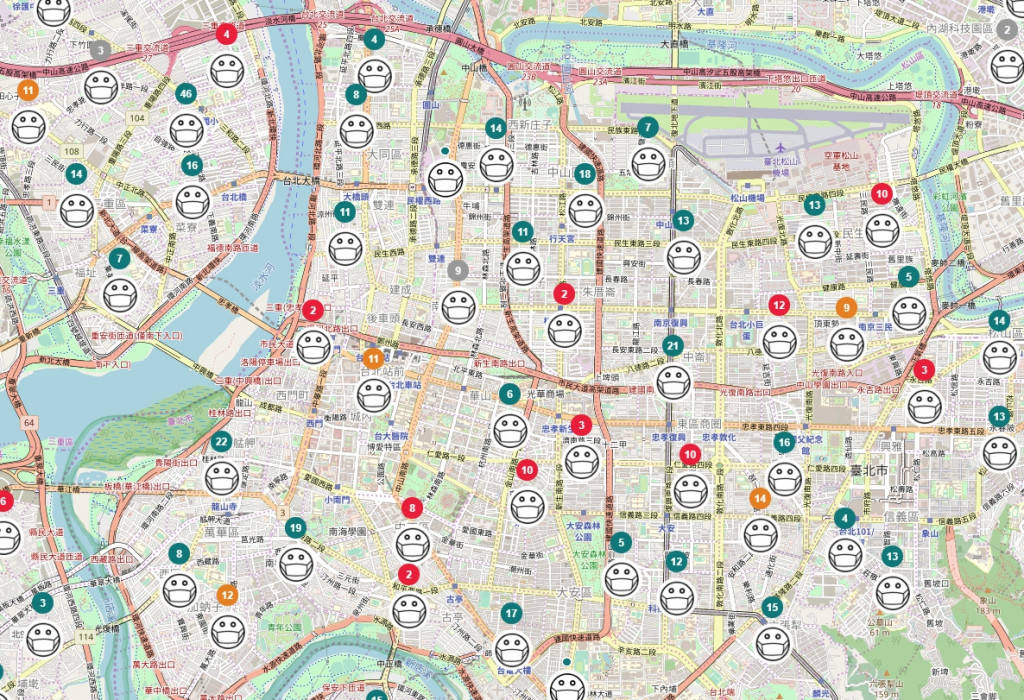
};如果一次顯示所有的圖標,效能會非常差,且無法閱讀,所有資訊都擠在一起。
這裡會使用 「Leaflet.markercluster」 解決這個問題,此套件可以根據地圖縮放比例,將重疊的圖標合併,效果不錯推薦大家玩玩看。
GitHub 連結: https://github.com/Leaflet/Leaflet.markercluster
合併後也會分成 4 種顏色,以綠色為優先。
例如:
綠色 +
紅色= 綠色
紅色+ 灰色 =紅色
//圖標的 class 樣式
var imageClass = ["image0-icon", "image1-icon", "image2-icon", "image3-icon"];

//設定合併邏輯
var markers = new L.MarkerClusterGroup({
    iconCreateFunction: function (cluster) {
        var list = cluster.getAllChildMarkers();
        var level = 0;

        for (var i = 0; i < list.length; i++) {
            if (level < 3 && list[i].options.icon.options.iconUrl ===
                image3Icon.options.iconUrl)
                level = 3;
            else if (level < 2 && list[i].options.icon.options.iconUrl ===
                image2Icon.options.iconUrl)
                level = 2;
            else if (level < 1 && list[i].options.icon.options.iconUrl ===
                image1Icon.options.iconUrl)
                level = 1;
        }
        return L.divIcon({
            html: '<div><span>' + cluster.getChildCount() + '</span></div>',
            className: "icon-cluster " + imageClass[level],
            iconSize: [50, 50]
        });
    },
    removeOutsideVisibleBounds: true,
    animate: true
}).addTo(map);
[2020/02/14 更新]
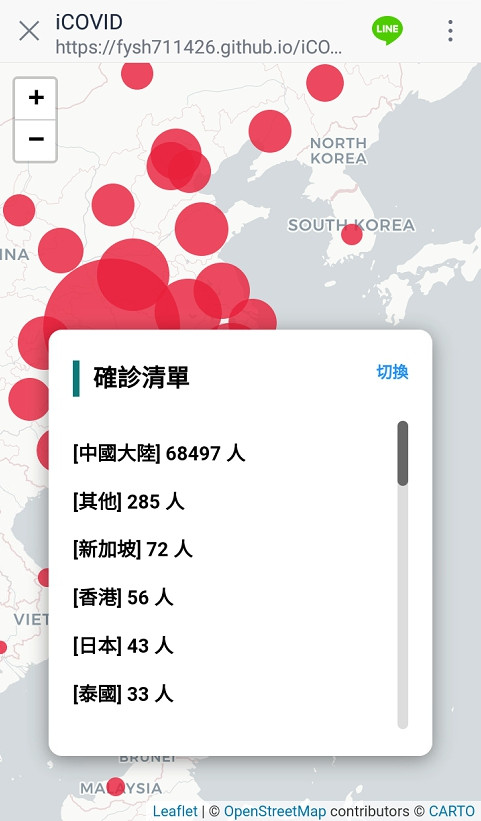
最近新聞報導了 PTT 網友 coffee777 製作的 「台灣版武漢肺炎地圖」
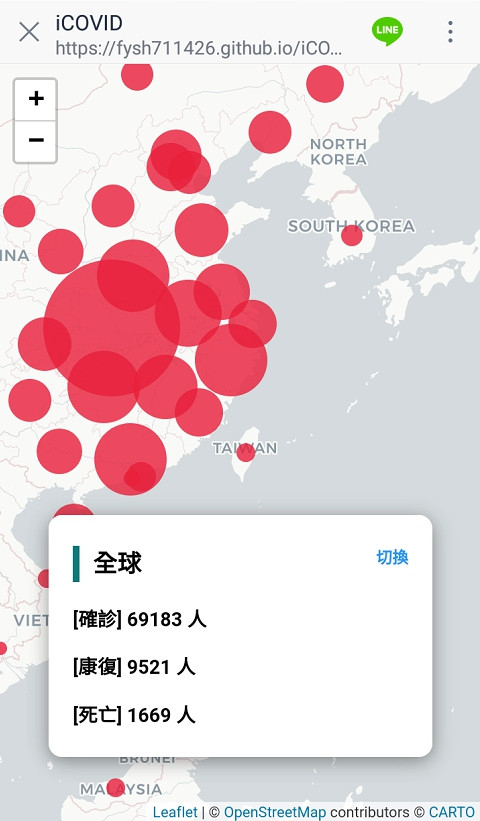
網站介面透過不同大小的圓點,表示各國的確診人數,圓點越大表示人數越多
資料圖像化後一目瞭然,可以快速看出疫情分布狀況,有興趣的朋友可以玩玩看
我自己做了一個簡易版,接著就來和大家分享這次的製作心得
研究了一下,各國確診人數資料可以從這個 GitHub 取得,不過資料格式是 CSV。
https://github.com/CSSEGISandData/COVID-19
後來找到國外網友使用上面資料製作的 JSON 格式 API。
https://github.com/ExpDev07/coronavirus-tracker-api
不過程式寫完後,發現人數和網站對不上 (╯‵□′)╯︵┴─┴
找不到原因,最後只好乖乖使用和網站相同的 API。
ArcGIS 連結: ncov_cases
下面是我使用的查詢條件,可以取得各國的確診、康復、死亡人數。
var xhr = new XMLHttpRequest();
xhr.open('get','https://services1.arcgis.com/0MSEUqKaxRlEPj5g/arcgis/rest/services/ncov_cases/FeatureServer/1/query?f=json&where=1%3D1&returnGeometry=false&spatialRel=esriSpatialRelIntersects&outFields=*&orderByFields=Confirmed%20desc%2CCountry_Region%20asc%2CProvince_State%20asc&resultOffset=0&resultRecordCount=250&cacheHint=true');
xhr.send();
xhr.onload = function () {
    var data = JSON.parse(xhr.responseText).features;
    ...
};
ArcGIS 服務可以透過 QueryString 改變查詢條件,有興趣的朋友可以開啟瀏覽器 Network,查看作者用法。
要注意使用條款,不能用於商業用途。
用法和口罩地圖相同,不過為了凸顯紅點,這次我使用較淺色系的地圖樣式。
L.tileLayer('https://{s}.basemaps.cartocdn.com/light_all/{z}/{x}/{y}{r}.png', {
    attribution: '© <a href="https://www.openstreetmap.org/copyright">OpenStreetMap</a> contributors © <a href="https://carto.com/attributions">CARTO</a>'
}).addTo(map);
更多地圖樣式: http://leaflet-extras.github.io/leaflet-providers/preview/index.html
我設計了一個函數,可以將人數轉為紅點大小。
function getRadius(count) {
    var radius = 0;
    if (count >= 1000000) {
        radius = 85;
        radius = radius + 3.0 * (parseInt(count / 1000000) % 10);
    }
    else if (count >= 100000) {
        radius = 60;
        radius = radius + 2.5 * (count / 100000);
    }
    else if (count >= 10000) {
        radius = 40;
        radius = radius + 2.0 * (count / 10000);
    }
    else if (count >= 1000) {
        radius = 25;
        radius = radius + 1.5 * (count / 1000);
    }
    else if (count >= 100) {
        radius = 15;
        radius = radius + 1.0 * (count / 100);
    }
    else if (count >= 0) {
        radius = 5;
        radius = radius + 1.0 * (count / 10);
    }
    return radius;
}
取得大小後使用 circleMarker 標記在地圖上。
//計算大小
var radius = getRadius(item.Confirmed);

//產生圓點
var circle = L.circleMarker([item.Lat, item.Long_], {
    radius: radius,
    stroke: false,
    fillColor: '#e91e3a',
    fillOpacity: 0.8,
    bubblingMouseEvents: false
});

//將資料放在 circle 內
circle.data = item;

//標記在地圖上
circle.addTo(map)
    .on('click', click);

//處理點擊事件
function click(e) {
    var circle = e.target;
    //將資料填入 Popup
    title.innerHTML = ...
    confirmed.innerHTML = '[確診] ' + circle.data.Confirmed + ' 人';
    recovered.innerHTML = '[康復] ' + circle.data.Recovered + ' 人';
    deaths.innerHTML = '[死亡] ' + circle.data.Deaths + ' 人';
    ...
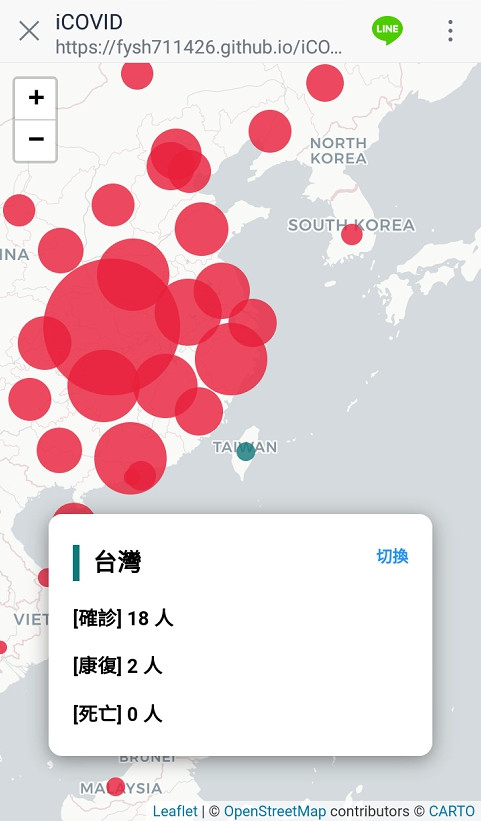
    //點擊後將圓點變為綠色
    focus = circle.setStyle({
        fillColor: '#107879',
        fillOpacity: 0.8
    });
};
今天就到這裡,感謝大家觀看。 (´・ω・`)
