Cache gRPC connections #1164
Comments
|
Forgot to mention the request interceptor does'nt work too in my test... if you can explain me how to implement it the right way ?! |
|
Thanks for the note @pierre-b . @stephenplusplus , thoughts on switching our transport? |
|
Unfortunately, wreck is only written for Node v4 and greater. We still need to support v0.12.0. We switched Pub/Sub to use gRPC and proto files with our last release. Because that library is used, the request interceptors don't have an impact. I'll make a note of that in the docs. When I'm trying to test with your repo, I'm running into: Is there a quick solution to get past that? |
|
Thank you guys for investigating this! @stephenplusplus maybe you need to clear your cookies? looks like HAPI tries to parse something on your localhost?! |
|
Thanks, that did it. Can you show the passenger command you're running to see that output? |
|
|
|
In your demo, after downgrading to gcloud@0.27.0, the memory hike was negligible. I believe this can be traced to grpc, which was introduced as the Pub/Sub transport in version gcloud@0.28.0. |
|
I confirm 0.27.0 is much better! |
|
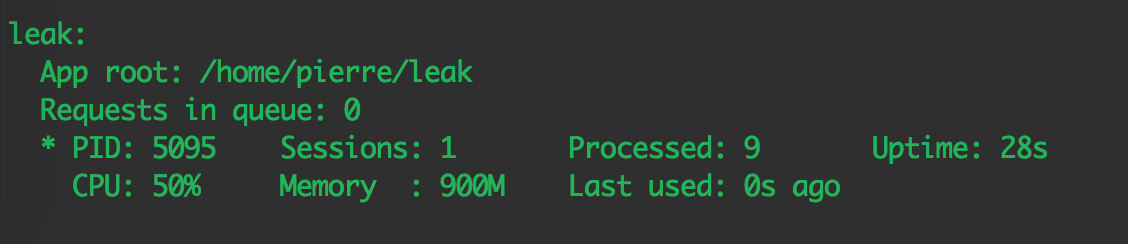
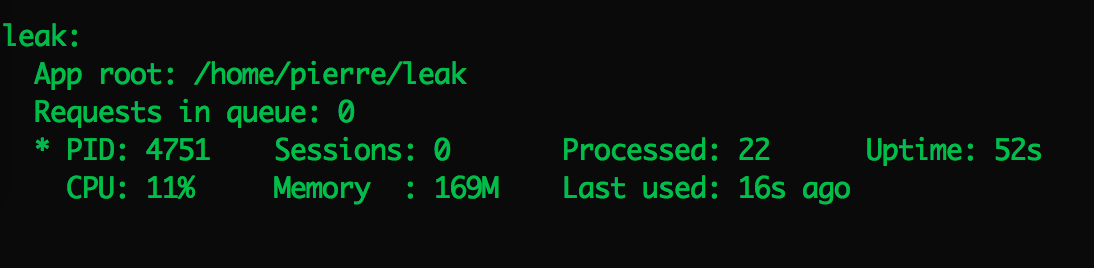
Also, request@2.53.0 used in gcloud@0.27.0 consumes 27% less memory than request@2.69.0. 22 requests (each request publishes 100 messages in parallel): |
|
@pierre-b would you mind opening an issue on the grpc repo about the high memory usage? I tried digging into it, but no doubt they'd be more efficient. |
|
There is no open issue regarding a memory leak on the grpc nodejs repo, are you sure the problem comes from them and not the pubsub implementation? As I never implemented the grpc node package I don't feel rightful to open an issue on their repo! |
|
I completely understand :) @murgatroid99 The test @pierre-b put together instantiates a service 100x, which hikes the memory usage up by about 100 MB. We don't retain a reference to the object, but it seems to persist in memory. Is this something that will be resolved once we pre-compile the proto files and use message objects (#1134 (comment))? |
|
This usage pattern is not expected or intended to be performant. Each time you instantiate a service object, it creates a channel, which contains a number of things, including a full TCP socket/TLS session/HTTP2 session stack. This has to stay alive at least until the call you make with it is complete. It would be better to initialize a single client object per server/service combination, and then use it for every call to that service on that server. This will allow gRPC to multiplex the calls on a single TCP connection, and will avoid having to deal with initial connection delay every single time you make a call. |
|
Thanks, that gives me a lot to think about. I'm still wondering why the memory remains after the service calls have been made, however. Is there an extra step to stop the channel? Also, regarding caching service connections, it will be difficult to know if a user is making a single call or many. Is there a default amount of time that passes that will close a channel? Would this caching be better handled within grpc? |
|
To be specific, the sequence of events in that test looks something like this for a single call:
The channel can only be closed (and the associated memory released) after steps 4, 5, and 7 all complete, and two of those depend on when the Node garbage collector feels like running. Of course, it is possible that there is also an actual memory leak, but it may just look like a leak because the Node object wrapping the Channel gets collected before the actual channel goes away. Regarding caching, I don't know the exact numbers, but I would guess that in general, it is better to cache every single channel than to create even two channels when one could have been used. As far as I know, there is currently no default time after which a channel is closed. In some sense, the caching is handled within gRPC: the intention is that the user creates a channel object once, uses it to make every call they need to make, and then disposes of it. There has been some consideration of the idea of reusing connections for channels with the same target, but as far as I know, we don't actually have a plan or design for that yet. |
|
@stephenplusplus the test /pierre-b/test-leak instantiates the service once (line 168) to send 100 requests. @murgatroid99 yes the garbage collector released some memory (had to wait a while) but only the half... do you know why it's not clearing everything? Thx |
|
It's actually our own code that creates multiple service objects ("service" being a Protobuf term in this context) each time You can play around with forcing garbage collection to see if that clears up the other half. |
|
In my experience, memory shoots up by about ~100 MB when 100 calls are made. I didn't observe the same release of memory after time that you did, @pierre-b. I tried forcing garbage collection up to 2 minutes after the response was sent. After multiple tests, I only see around 7 MB being freed up.
In the case of this library, I think we'll always need it immediately closed, since we can't predict the next actions a user will take. That's why I was thinking of implementing something of a "timeout" so that if we don't use the channel within e.g., 120 seconds, the channel is then closed for us. If there was such a thing as a channel's maximum lifetime, that would save a lot of micro-management of open connections. |
|
Yes that would be great! thanks for your test |
|
Thanks, will try it out ;) |
|
Opened an issue on the gRPC library to track the memory leak: grpc/grpc#5970 |
|
Hello guys, I've just started using gcloud-node, 3 days ago. I am using Pub/Sub to publish a stream of packets that my server receives, converts to JSON and publish it. I see all related issues to this memory leak problem are closed, so let me know if you guys would like me to open a new issue. I've isolated the problem and the memory leak happens only when using cloud topic.publish a lot of times. My environment is:
Below is the chart showing how the memory increases, from process.memoryUsage(). From 17:10 to 17:50 there is an execution measure in the aforementioned environment.
Please let me know if any further information is needed. |

|
Thanks for the report. I believe this was resolved upstream in gRPC, although it hasn't been merged yet:
It will probably take a while for the change to appear in this library. You should be able to install grpc from that PR's branch manually in the meantime: $ npm install --save murgatroid99/grpc#node_client_creds_memory_leak |
|
Sorry about the crashing :( |
|
Ok, thanks Stephen! |
Hello guys,
I use PubSub to pulish thousands of messages and a memory leak crashes my server.
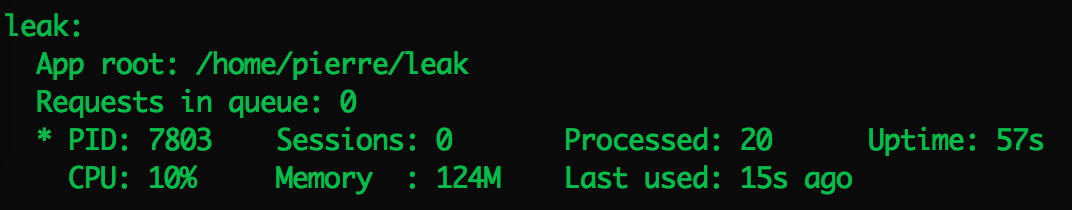
Here is a Passenger screenshot using gcloud:
Using request:
Here is a simple repo to reproduce it: https://github.com/pierre-b/test-leak
Environnement:
Did I miss something?
thanks for your help
The text was updated successfully, but these errors were encountered: