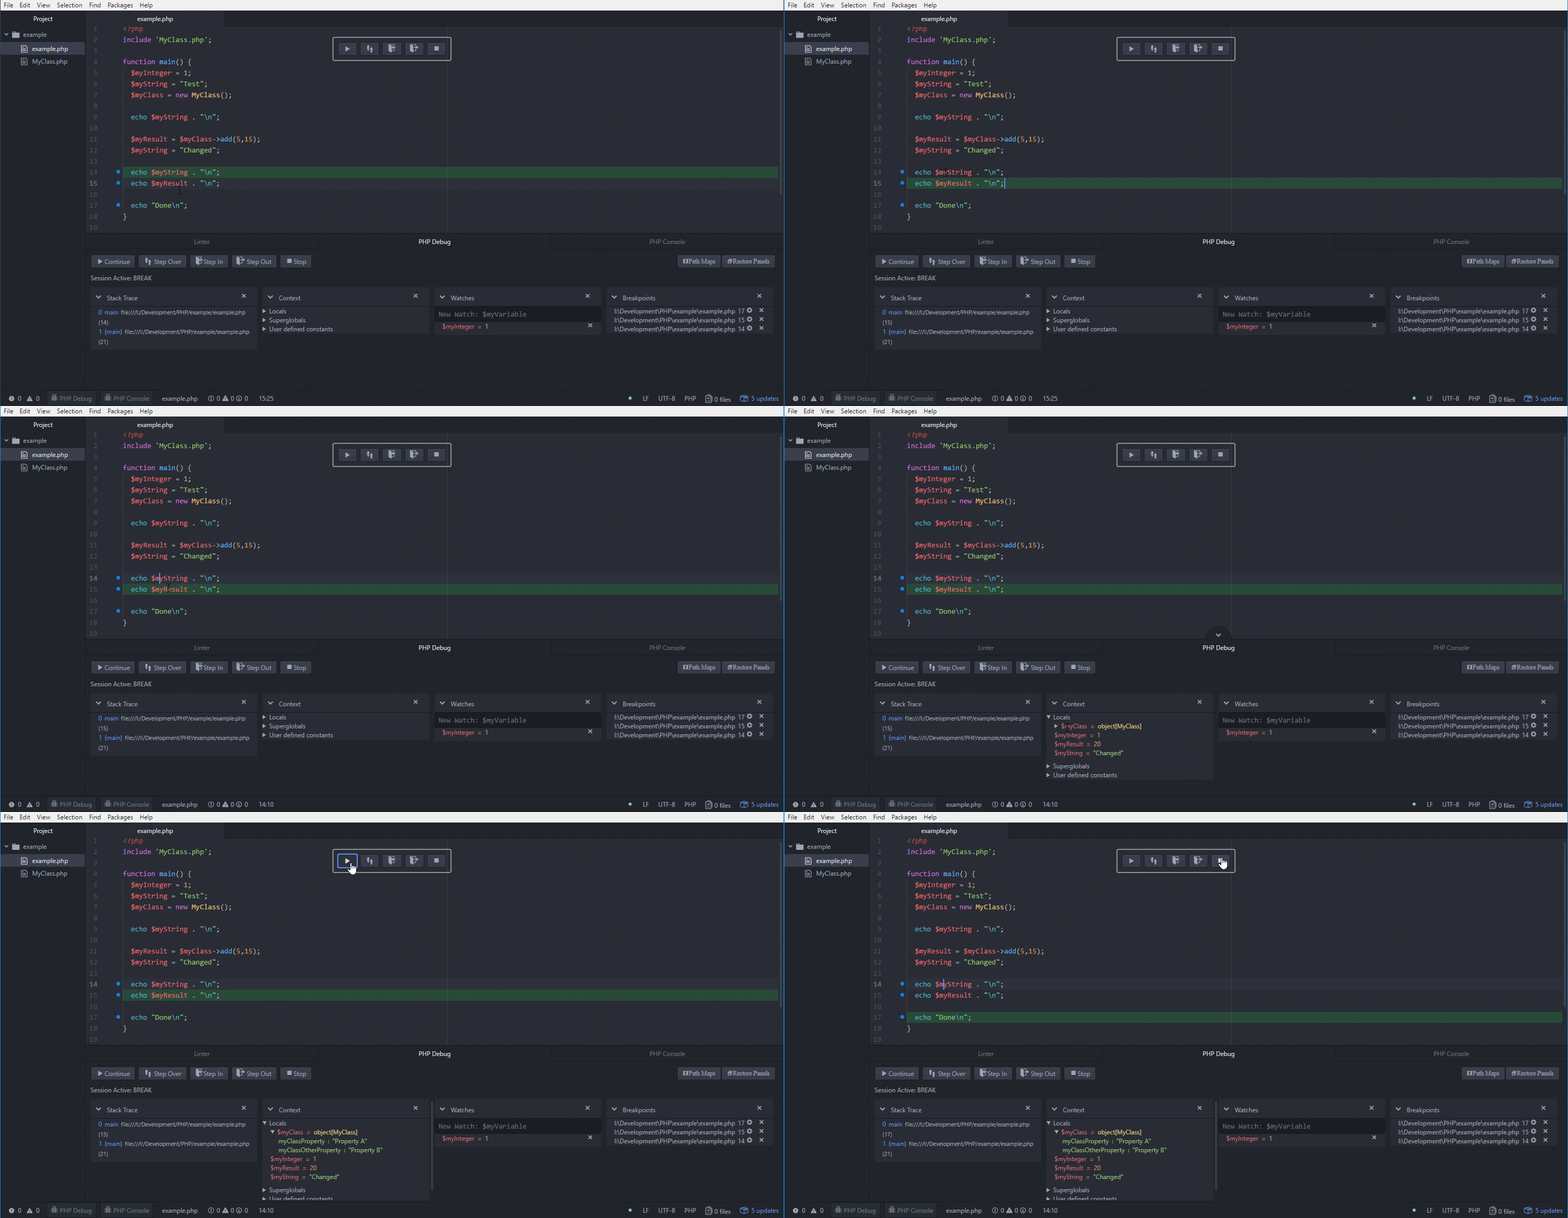
Debug PHP code using the Xdebug PHP Extension.
- Interactive Console
- Breakpoints
- Watches
- Multiple Debug Sessions
- Path Mappings
- Step through debugging (Over, In, Out)
- Stack and Context views
- UTF8 Support
- Uses atom-debug-ui
This is currently an alpha release, and still in active development.
You may already have Xdebug installed. Check the results of the phpinfo function for xdebug information. If no xdebug section exists, you likely need to install this. *nix users can likely find it within their package manager of choice. Alternative installation or compiling instructions are available here.
xdebug.remote_enable=1
xdebug.remote_host=127.0.0.1
xdebug.remote_connect_back=1    # Not safe for production servers
xdebug.remote_port=9000
xdebug.remote_handler=dbgp
xdebug.remote_mode=req
xdebug.remote_autostart=true
With these settings, PHP will connect to your editor for every script it executes. The alternative is to switch xdebug.remote_autostart to false, and install an Xdebug helper extension for your browser of choice, such as:
- The easiest Xdebug for Mozilla Firefox
- Xdebug Helper for Google Chrome
These browser extensions will give you a button within your browser to enable/disable Xdebug. The extensions might have configuration options for an "IDE key" (which is used for an XDEBUG_SESSION cookie). The IDE key for Atom with PHP Debug is "xdebug-atom".
It is also possible to run a php script from the command line with Xdebug enabled. You can find more information on this at the Xdebug documentation for Starting The Debugger. See can find a complete list and explanation of Xdebug settings here.
To begin debugging:
- Open up your PHP file in atom
- Add a breakpoint:
Move the cursor to a line you want to break on and set a breakpoint by pressing Alt+F9, selecting Toggle Breakpoint from the Command Palette (ctrl+shift+p)or with the php-debug menu (Packages -> php-debug->Toggle Breakpoint).
This will highlight the line number green, to indicate the presence of a breakpoint.
- Open the debug view by pressing
ctrl+alt+d, selecting 'Toggle Debugging' from the Command Palette or php-debug menu. - Start the script with Xdebug enabled. If everything is setup correctly, the entire line of the breakpoint will be highlighted in green, indicating the current line of the script.
If everything worked correctly, you can now use the various buttons/commands to step through the script.
This is the port that the atom client will listen on. Defaults to 9000
This is the address that the atom client will listen on. Defaults to 127.0.0.1
Outputs protocol debugging messages to the atom debug console
Max depth for variable scopes
Maximum number of array elements to show in variables
Maximum data for variables
Sort Arrays/Object alphabetically instead of by php default
Allow PHP Debug to be opened from the status bar
Default exceptions and errors for PHP-Debug to break on
Pathmaps are now configured for each project folder during connection
