Implementation of the model used in the paper Protest Activity Detection and Perceived Violence Estimation from Social Media Images (ACM Multimedia 2017) [arxiv] by Donghyeon Won, Zachary C. Steinert-Threlkeld, Jungseock Joo.
Pytorch
NumPy
pandas
scikit-learn
python train.py --data_dir UCLA-protest/ --batch_size 32 --lr 0.002 --print_freq 100 --epochs 100 --cudapython pred.py --img_dir path/to/some/image/directory/ --output_csvpath result.csv --model model_best.pth.tar --cuda You will need to download our UCLA Protest Image Dataset to train the model. Please e-mail me if you want to download our dataset!
# of images: 40,764
# of protest images: 11,659
| Fields | Protest | Sign | Photo | Fire | Police | Children | Group>20 | Group>100 | Flag | Night | Shouting |
|---|---|---|---|---|---|---|---|---|---|---|---|
| # of Images | 11,659 | 9,669 | 428 | 667 | 792 | 347 | 8,510 | 2,939 | 970 | 987 | 548 |
| Positive Rate | 0.286 | 0.829 | 0.037 | 0.057 | 0.068 | 0.030 | 0.730 | 0.252 | 0.083 | 0.085 | 0.047 |
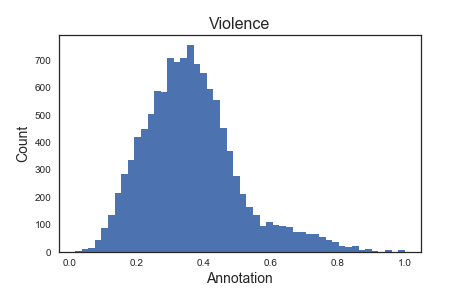
| Mean | Median | STD |
|---|---|---|
| 0.365 | 0.352 | 0.144 |
We fine-tuned ImageNet pretrained ResNet50 to our data. You can download the model I trained from this Dropbox link.
| Protest | Sign | Photo |
|---|---|---|
 |
 |
 |
| Fire | Police | Children |
|---|---|---|
 |
 |
 |
| Group>20 | Group>100 | Flag |
|---|---|---|
 |
 |
 |
| Night | Shouting | Violence |
|---|---|---|
 |
 |
 |

