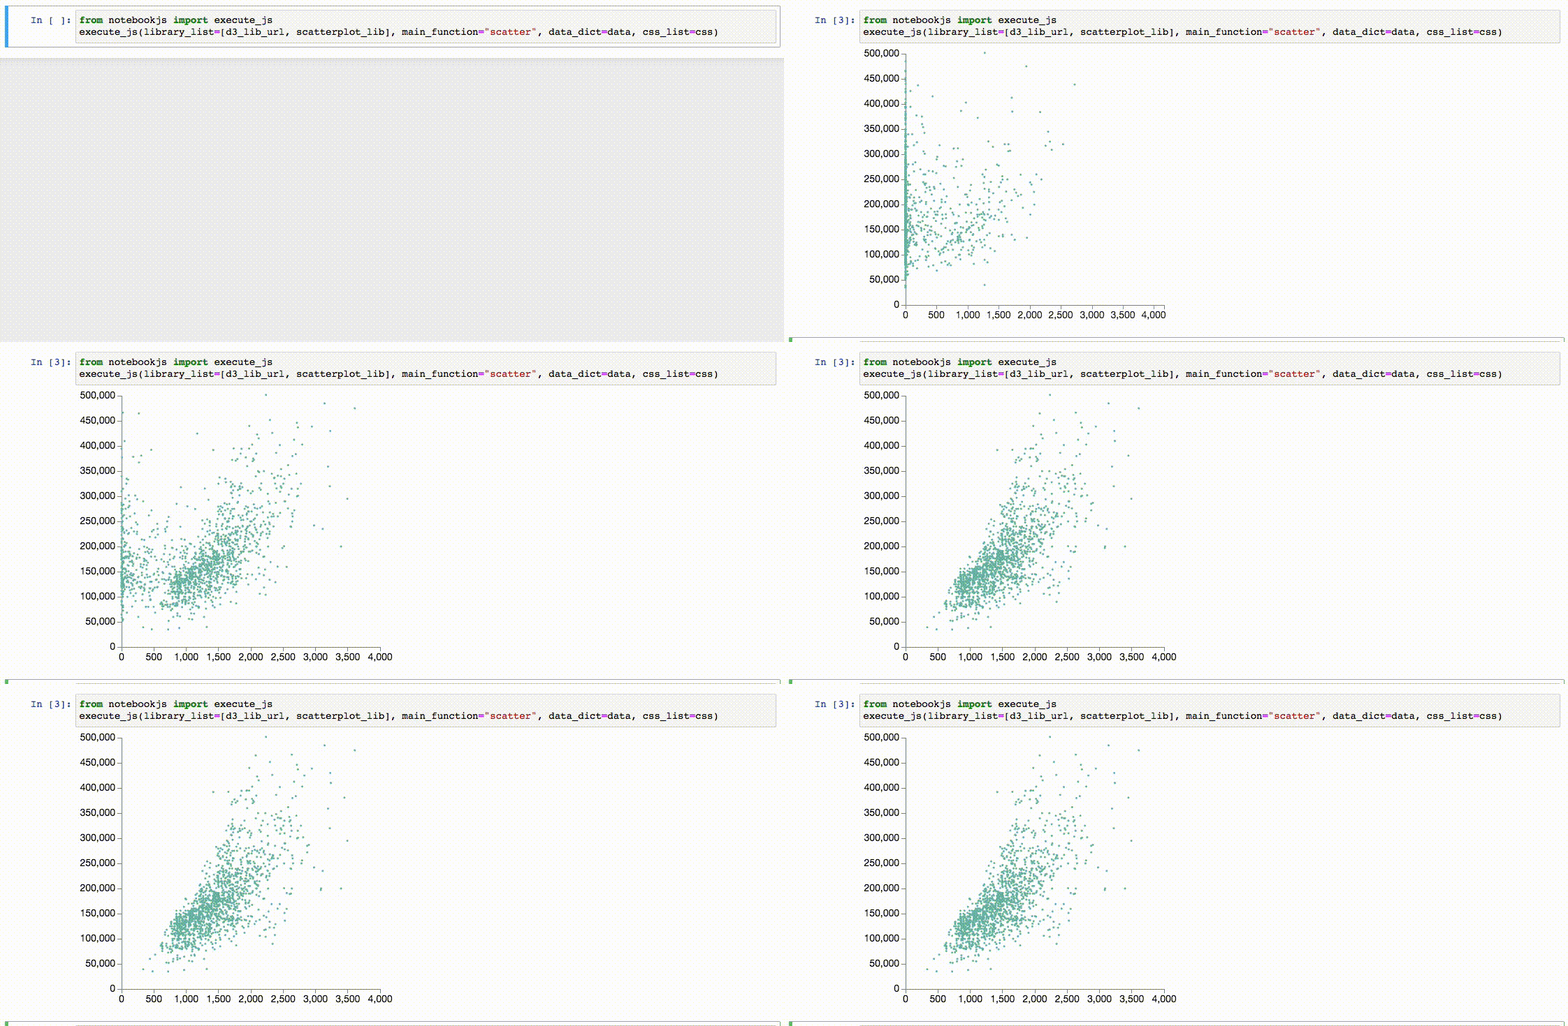
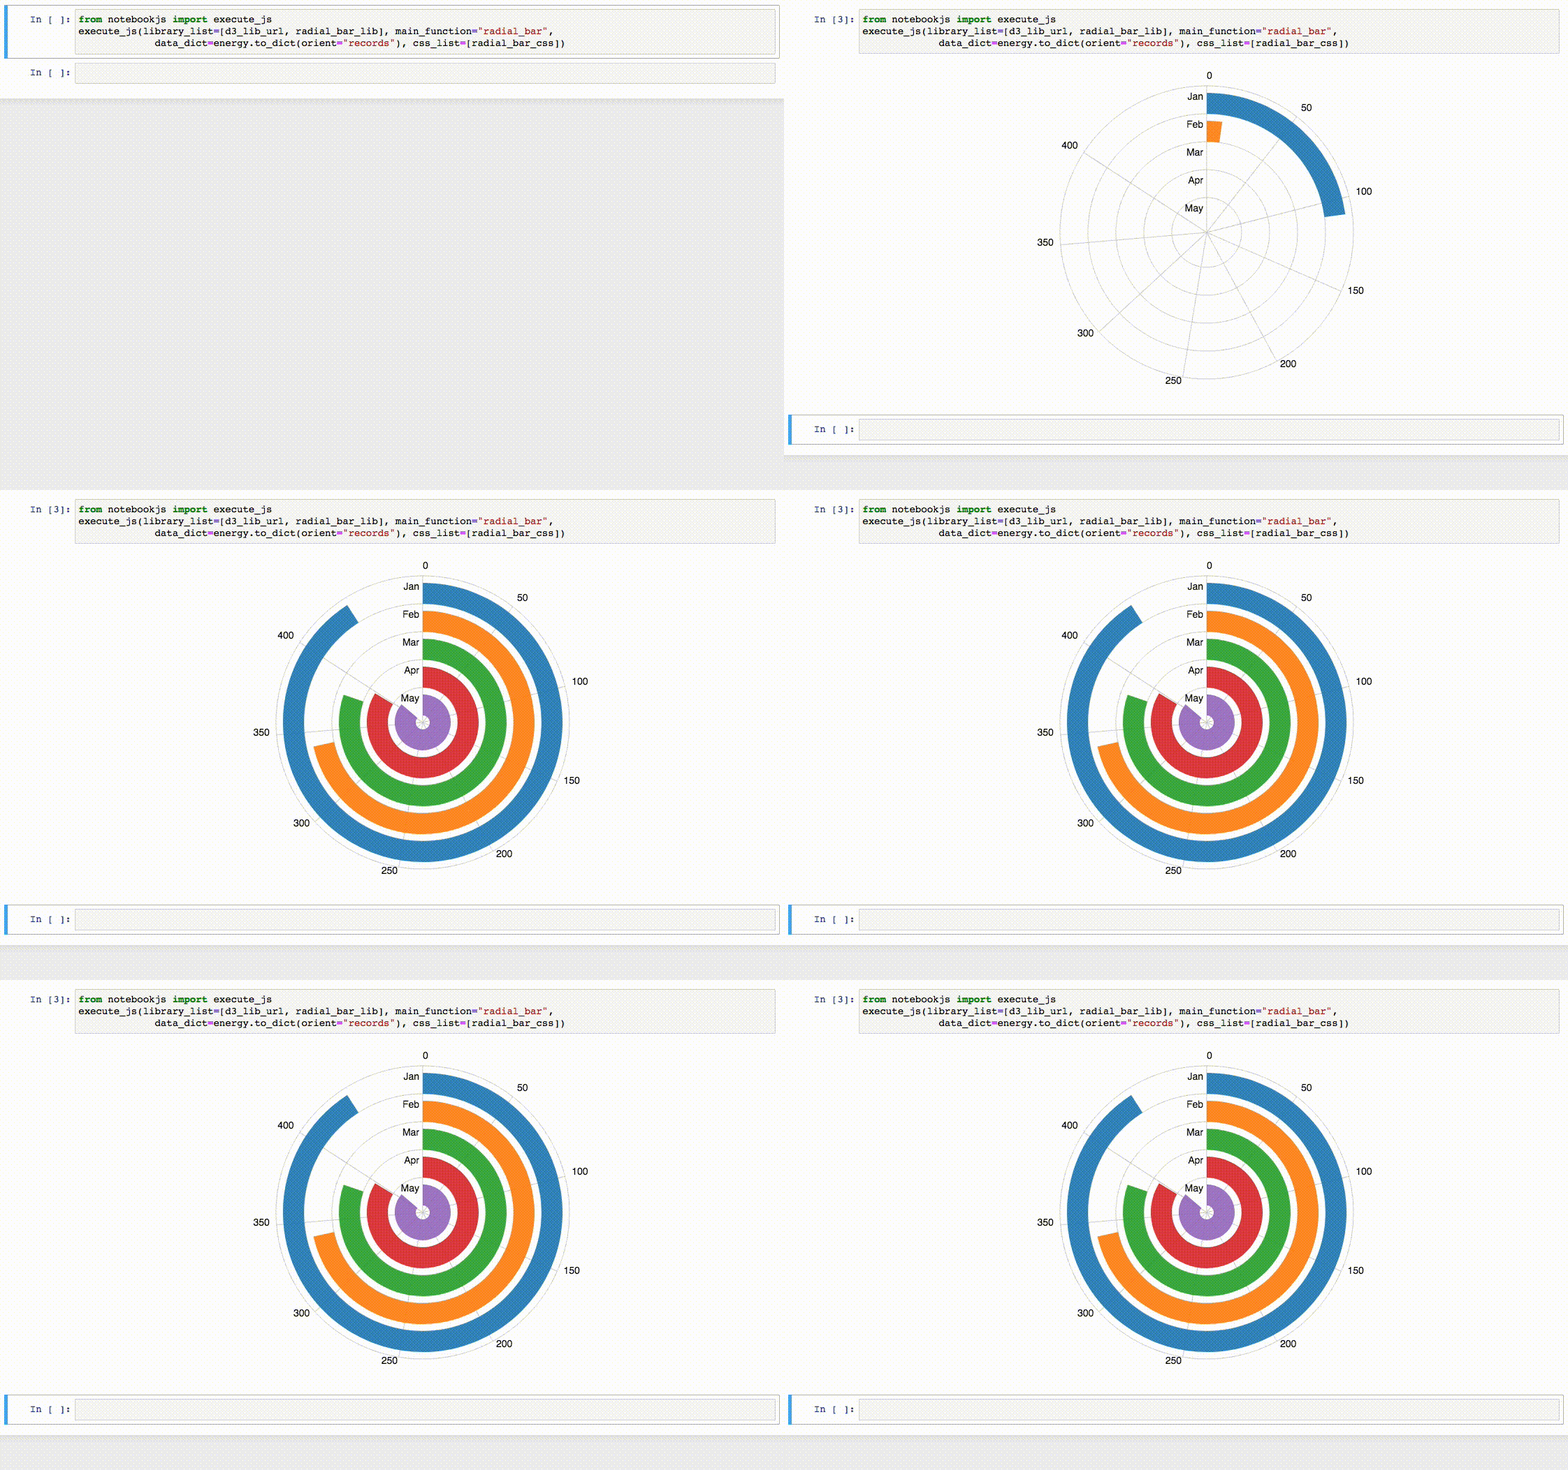
notebookJS enables the execution of custom JavaScript code in Python Notebooks (Jupyter Notebook and Google Colab). This Python library can be useful for implementing and reusing interactive Data Visualizations in the Notebook environment.
notebookJS takes care of downloading and handling Javascript libraries and CSS stylesheets from the web. Furthermore, it supports bidirectional communication between Python and JavaScript. User interactions in HTML/JavaScript can trigger Python callbacks that process data on demand and send the results back to the front-end code.
Implementation details in our paper.
See our blog post.
To install, run:
pip install notebookjs
Or clone this repository and run:
python setup.py install
This method executes a javascript function and sets up the infrastructure for bidirectional communication between Python and Javascript using callbacks.
execute_js(
    library_list,
    main_function,
    data_dict={},
    callbacks={},
    css_list=[],
)
Parameters
- library_list : list of str. List of strings containing either 1) URL to a javascript library, 2) javascript code, 3) javascript bundle (Plain JS only - No support for ES6 Modules)
- main_function : str. Name of the main function to be called. The function will be called with two parameters: <div_id>, for example "#my_div", and <data_dict>.
- data_dict : dict. Dictionary containing the data to be passed to <main_function>
- callbacks : dict. Dictionary of the form {<callback_str_id> : <python_function>}. The javascript library can use callbacks to talk to python.
- css_list : list of str. List of strings containing either 1) URL to a CSS stylesheet or 2) CSS styles
Main Function
main_function is the javascript function that will be run when execute_js is called. It has the following signature:
function main_function(div_id, data_dict)Example of Main Function
As a simple example, we can use D3 to add a circular div to the output cell:
function draw_circle(div_id, data){
  // Function that draws a circle of color <data.color> inside the div <div_id> using D3
  d3.select(div_id)
    .append("div")
    .style("width", "50px")
    .style("height", "50px")
    .style("background-color", data.color)
    .style("border-radius", "50px")
}
Callbacks
callbacks contains a dictionary that maps an identifier string to a Python function. Data is passed to/from callbacks using json/dicts.
For example, the following callback computes the number to the power of 2.
def compute_power_2(data){
    n = data.n
    n2 = n**2
    return {"power2": n2}
}

callbacks = {
    "compute_power_2": compute_power_2
}

execute_js(..., callbacks=callbacks)
In Javascript, we can call this callback with the class CommAPI. CommAPI is automatically injected in the Javascript by notebookJS.
let comm = new CommAPI("compute_power_2", (ret)=>{alert("The returned value is " + ret.power2)})

comm.call({n: 3})
// An alert will be shown with the message: "The returned value is 9"
Jupyter Notebook and Google Colab have different APIs for sending data to/from Javascript/Python. CommAPI abstracts the different APIs in a single convenient class.
Warning: Callbacks between Python and JS are only available in Jupyter and Colab notebooks. Jupyter Lab is not supported currently.
This method creates a standalone HTML bundle (containing all data, JS and CSS resources) and saves it to disk. It accepts all parameters of execute_js, with the addition of html_dest, the path to the output file. For example, html_dest="./output.html"
save_html(,
    html_dest,
    library_list,
    main_function,
    data_dict={},
    callbacks=None,
    css_list=[],
)
Warning: callbacks do not work in standalone HTML files. This parameter only exists to make execute_js and save_html interoperable.
In this example, we show how to display "hello world" in multiple languages using Javascript and Python. The Javascript is responsible for updating the front end and requesting a new message from Python. Python returns a random message every time the callback is invoked.
Javascript to update the div with a hello world message
helloworld_js = """
function helloworld(div_id, data){
    comm = new CommAPI("get_hello", (ret) => {
      document.querySelector(div_id).textContent = ret.text;
    });
    setInterval(() => {comm.call({})}, 1000);
    comm.call({});
}
"""
Defining the Python Callback
import random
def hello_world_random(data):
  hello_world_languages = [
      "Ola Mundo", # Portuguese
      "Hello World", # English
      "Hola Mundo", # Spanish
      "Geiá sou Kósme", # Greek
      "Kon'nichiwa sekai", # Japanese
      "Hallo Welt", # German
      "Namaste duniya", # Hindi
      "Ni hao, shijiè" # Chinese
  ]
  i = random.randint(0, len(hello_world_languages)-1)
  return {'text': hello_world_languages[i]}
Invoking the function helloworld in notebook
from notebookjs import execute_js
execute_js(helloworld_js, "helloworld", callbacks={"get_hello": hello_world_random})
See this colab notebook for a live demo.
Plotting a Radial Bar Chart with data loaded from Python. Adapted from this bl.ock. See Examples/3_RadialBarChart.
# Loading libraries
d3_lib_url = "https://d3js.org/d3.v3.min.js"

with open("radial_bar.css", "r") as f:
    radial_bar_css = f.read()

with open ("radial_bar_lib.js", "r") as f:
    radial_bar_lib = f.read()

# Loading data
import pandas as pd
energy = pd.read_csv("energy.csv")

# Plotting the Radial Bar Chart
from notebookjs import execute_js
execute_js(library_list=[d3_lib_url, radial_bar_lib], main_function="radial_bar",
data_dict=energy.to_dict(orient="records"), css_list=[radial_bar_css])Please see the Examples/ folder for more examples.
If you use notebookJS, please reference our related work:
"Interactive Data Visualization in Jupyter Notebooks. JP Ono, J Freire, CT Silva - Computing in Science & Engineering, 2021"
Bibtex:
@article{ono2021interactive,
  title={Interactive Data Visualization in Jupyter Notebooks},
  author={Ono, Jorge Piazentin and Freire, Juliana and Silva, Claudio T},
  journal={Computing in Science \& Engineering},
  volume={23},
  number={2},
  pages={99--106},
  year={2021},
  publisher={IEEE}
}


