-
Notifications
You must be signed in to change notification settings - Fork 56
Java profiling with jvisualvm
Occasionally you may wonder, "Why is my code running so slowly?" No,
it's not because Joshua is written in Java;
it's probably because you wrote something inefficiently. We are often asked what tools exist for
profiling Joshua, so this page will describe one of them, jvisualvm, a free Java memory and CPU
profiling tool.
Starting the profiler is as easy as typing
$ jvisualvm
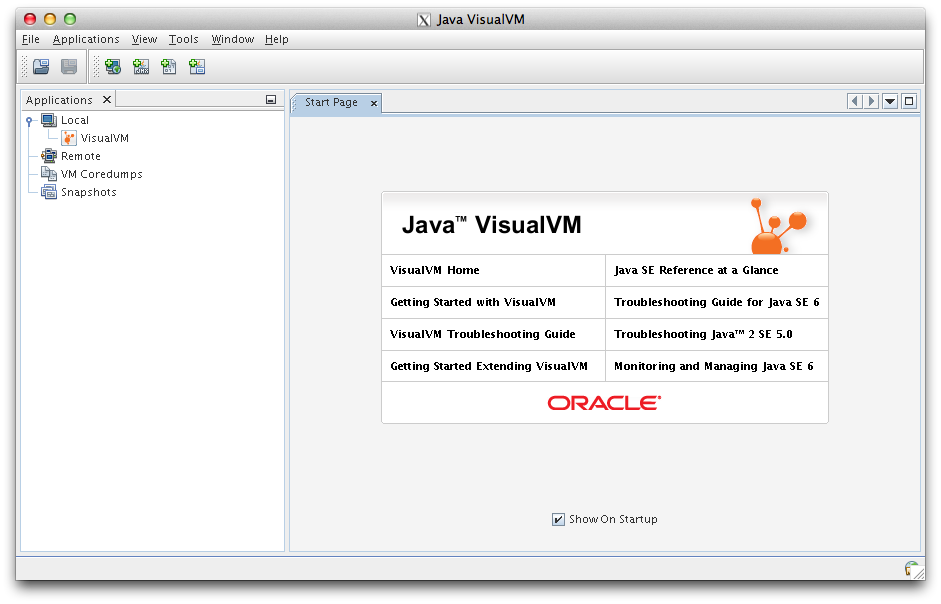
A graphical window will pop up that looks something like this:

If the Joshua job you want to run is a few hops away on a cluster, you can reach it by chaining X-forwarding over ssh. For example, suppose your cluster's nodes (say, "node17") are hidden behind a cluster head node ("head") which is in turn behind a firewall ("firewall"). You can chain ssh through each of these machines in a single step with the following command:
$ ssh -Y firewall -t ssh -Y head -t ssh -Y node17
node17 ~$
From there, you can start jvisualvm, which will forward back to your local display, assuming you are runnnig X11 (on Mac OS X, you want to run this from within a terminal in XQuartz).
Invoke the Joshua decoder on the same machine:
$ cat input.txt | $JOSHUA/bin/joshua-decoder -m 2g -threads 1 -c config -top-n 1 [other options...]
The Joshua process will now appear in the lefthand side pane of the jvisualvm window:
Double-click on the process to bring up a new tab for it, and choose the Profiler tab:
From there, you can start profiling the running application, choosing to profile for either memory or CPU usage:
The Settings checkbox allows you to narrow the profiling in various ways, and it's also worthwhile looking through the other process-specific tabs.


