##Description
The goal of this project is to do data analysis on public GitHub timeline data. Detail description of the analysis can be found at my blog: www.investuotojas.eu
##How to use it
Download GitHub timeline data from bigquery and save it as git.csv
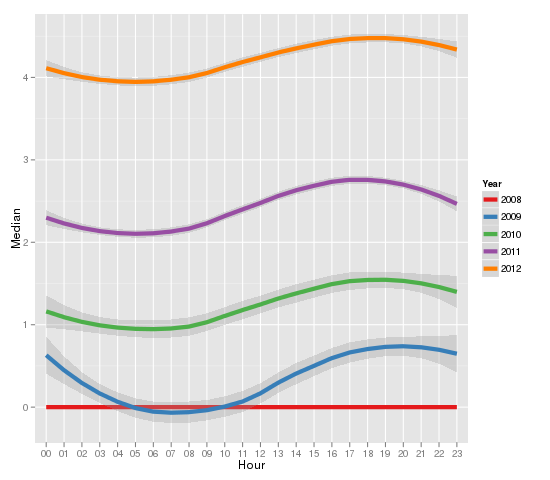
To produce following two graphs run actions.sh and actions.R
Run new_repos.sh and new_repos.R to produce following graph:
For forks vs watchers run fork_watch.sh and fork_watch.R:
##Contact If you have problems or questions - please contact me at twitter @dzidorius or by mail


