-
Notifications
You must be signed in to change notification settings - Fork 199
0002 Report Designer Basics
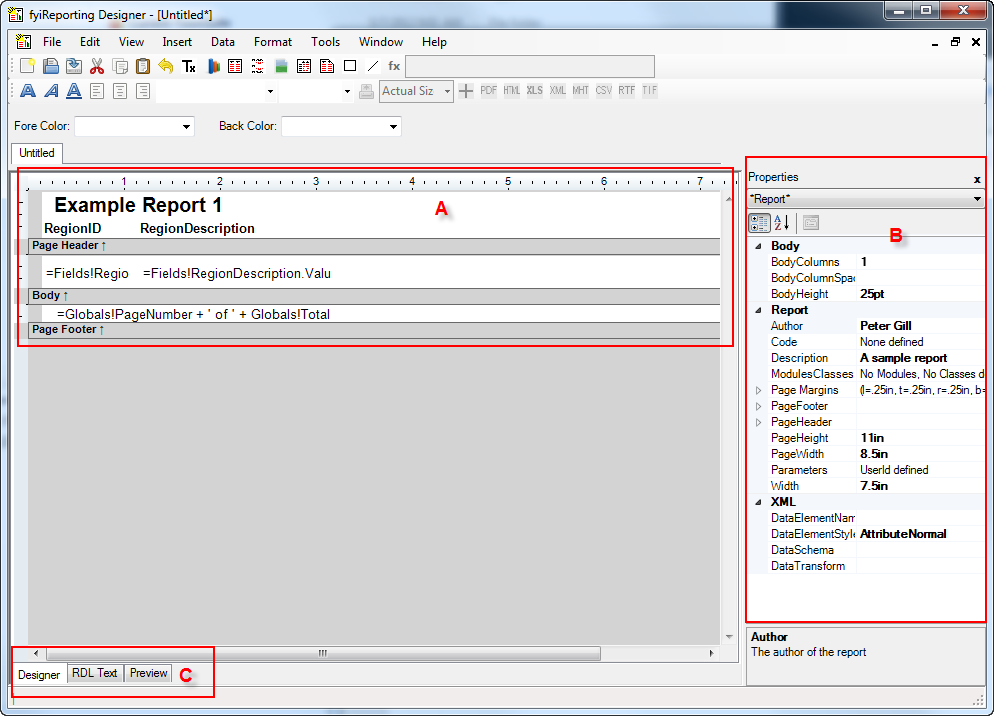
The Report Designer interface follows a pattern familiar to most programmers, showing a visual representation of the report bands and a properties panel. It is also vital to note the three possible views that allow you to switch between the Designer, the RDL XML code that defines the report, and the Report Preview.
A: Designer panel. This shows the layout of the report bands (such as header, body, and footer). The items on each band may be moved, resized, selected to see/change their properties, etc.
B: The side panel contains all the properties of the selected report item.
C: There are three options for the report you are viewing; Designer, RDL Text, and Preview. Any changes made in either the Designer or the RDL Text views will show up afterwards in the other view, or the Preview. You may switch between these 3 views using the top menu option View.. (which will tell you the F7 and F5 keyboard shortcuts).

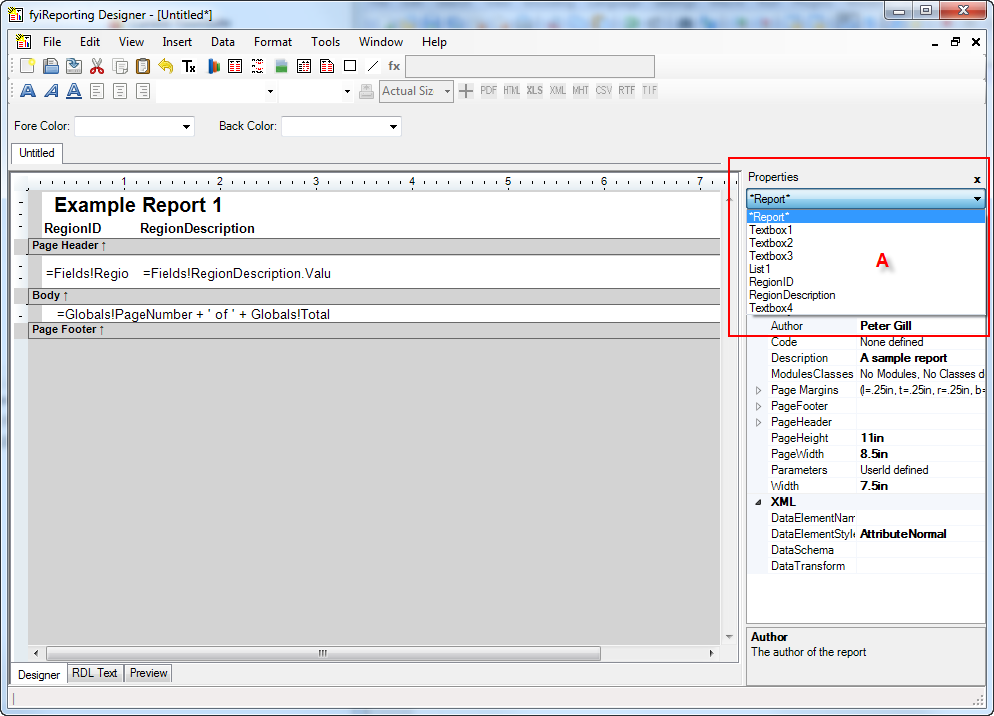
You can select any item on the report to show the properties. You can select the item in the drop down list A or by selecting it in the report designer.

You may also Right-Click on a field and see the Properties in a pop-up window which may show you even more options for that field.
A common requirement is to format a numerical field. To achieve this, right-click the field and select Properties. In the Value field on the Text tab, you will see something like =Fields!NumberField.Value
To format the number you may use the common formatting syntax like "#,##0.00" :
=Format(Fields!NumberField.Value,"#,##0.00")