Examples
On this page we present a number of examples for basic data extraction and frequently raised issues. All examples are coded in Python.
Extracting and plotting a variable
Retrieving a 2D slice
Retrieving a 2D slice with xarray
Plotting vertical cross-sections and profiles
Wind direction obtained from x y wind
Calculating model level height
For these examples, you will need to have the following packages installed, e.g. by pip:
pip install matplotlib netCDF4 numpy pyproj xarrayHere is an example in python of how to extract and plot weather data from the MET Nordic Analysis dataset, more precisely air temperature at 2 m height.
First, find the correct file for the time you are interested in, here 2021/08/01. Checkout files and data access for more information:
import numpy as np
import netCDF4

filename = "https://thredds.met.no/thredds/dodsC/metpparchive/"+\
           "2021/08/01/met_analysis_1_0km_nordic_20210801T12Z.nc"
ncfile = netCDF4.Dataset(filename)Next, print the information for the variables available in this netcdf file:
for variable in ncfile.variables:
    print(variable)
ensemble_member
forecast_reference_time
projection_lcc
time
x
y
air_pressure_at_sea_level
air_temperature_2m
altitude
cloud_area_fraction
integral_of_surface_downwelling_shortwave_flux_in_air_wrt_time
land_area_fraction
latitude
longitude
precipitation_amount
relative_humidity_2m
wind_direction_10m
wind_speed_10m
Then, the make a plot of a specific variable, extract the grid and the variable data. Choose the timestep for the hour you want, in accordance with the time variable.
import matplotlib.pylab as plt

latitudes   = ncfile.variables["latitude" ][:]
longitudes  = ncfile.variables["longitude"][:]
timestep    = 0
temperature = ncfile.variables["air_temperature_2m"][timestep, :, :]

plt.pcolormesh(longitudes, latitudes, temperature)
plt.show()
/tmp/ipykernel_25126/1695849048.py:8: UserWarning: The input coordinates to pcolormesh are interpreted as cell centers, but are not monotonically increasing or decreasing. This may lead to incorrectly calculated cell edges, in which case, please supply explicit cell edges to pcolormesh.
  plt.pcolormesh(longitudes, latitudes, temperature)

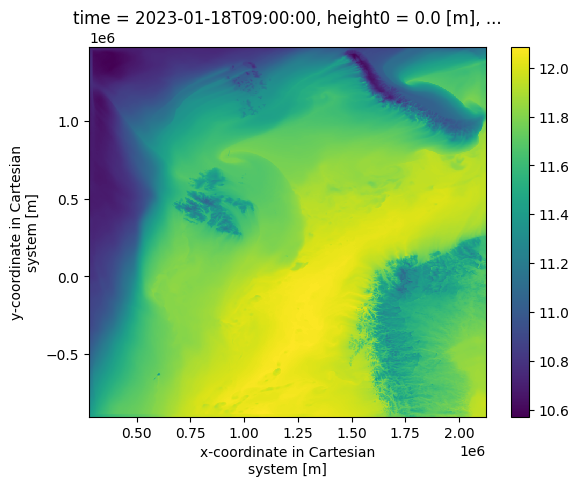
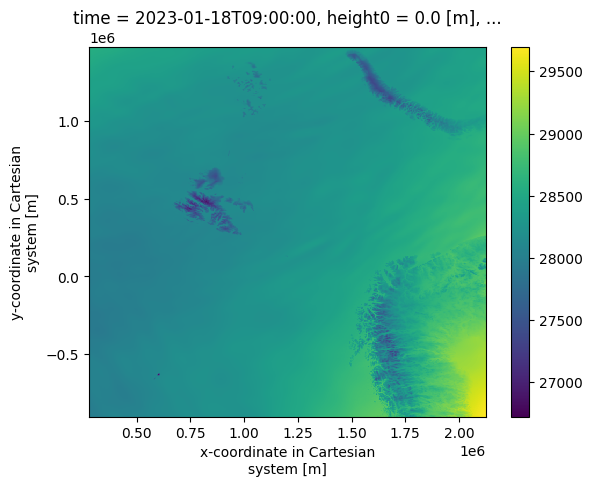
Here we present an example to extract 2D data through OPeNDAP, using lower level python modules. For extracting MEPS data, in contrast to MET Nordic data, the ensemble member has to be specified in addition to the timestep. We will extract the temperature field at screen level, which is only defined for a single height level, and therefore its spatial dimensions are x and y.
import netCDF4
import pyproj
import matplotlib.pyplot as plt

filename = "https://thredds.met.no/thredds/dodsC/mepslatest/meps_lagged_6_h_latest_2_5km_latest.nc"
ncfile   = netCDF4.Dataset(filename,"r")
# Print the shape of the dimensions (time,z_level,ensemble_members,y,x)
print(ncfile.variables["air_temperature_2m"].shape)

timestep        = 0
ensemble_member = 0
# Print the 2D-slice to output
print(ncfile.variables["air_temperature_2m"][timestep,0,ensemble_member,:,:]);
(62, 1, 30, 1069, 949)
[[278.7257 278.7516 278.7472 ... 281.93176 281.92297 281.84583]
[278.67834 278.68665 278.69104 ... 281.90198 281.8756 281.91858]
[278.5963 278.5963 278.6046 ... 281.91467 281.8927 281.90198]
...
[254.05334 254.04504 254.02356 ... 257.29016 257.3849 257.21692]
[254.01477 254.01038 254.00208 ... 256.81604 256.81165 256.69934]
[254.02795 253.9845 253.98938 ... 256.3849 256.32874 256.1261 ]]
xarray is a higher level Python module. Among others, it automatically adds labels to the plots.
import xarray as xr

filename = "https://thredds.met.no/thredds/dodsC/mepslatest/meps_lagged_6_h_latest_2_5km_latest.nc"
ncfile = xr.open_dataset(filename)
print(ncfile.air_temperature_2m.shape)
timestep = 0
ensemble_member = 0
ncfile.air_temperature_2m.isel(time = timestep,ensemble_member=ensemble_member).plot();
(62, 1, 30, 1069, 949)

This short example shows how to create Transformers from EPSG:4326 (WGS:84) for two of our projections (Arome Arctic and MEPS). See the next example for where to find this information from MEPS.
import pyproj

# Define CRS from the cf_variables
crs_MEPS = pyproj.CRS.from_cf(
    {
        "grid_mapping_name": "lambert_conformal_conic",
        "standard_parallel": [63.3, 63.3],
        "longitude_of_central_meridian": 15.0,
        "latitude_of_projection_origin": 63.3,
        "earth_radius": 6371000.0,
    }
)
crs_AA = pyproj.CRS.from_cf(
    {
        "grid_mapping_name": "lambert_conformal_conic",
        "standard_parallel": [77.5, 77.5],
        "longitude_of_central_meridian": -25.0,
        "latitude_of_projection_origin": 77.5,
        "earth_radius": 6371000.0,
    }
)

# Create Transformators with start projection and target projection
proj_MEPS = pyproj.Proj.from_crs(4326, crs_MEPS, always_xy=True)
proj_AA = pyproj.Proj.from_crs(4326, crs_AA, always_xy=True)

# This can then be used to transform lat lon to the carthesian coordinates in the projections
lat = 69
lon = 18
x_MEPS,y_MEPS = proj_MEPS.transform(lon,lat)
x_AA,y_AA = proj_AA.transform(lon,lat)
print(f"lat={lat},lon={lon} is projected to x={x_MEPS},y={y_MEPS} for MEPS")
print(f"lat={lat},lon={lon} is projected to x={x_AA},y={y_AA} for AA")
lat=69,lon=18 is projected to x=6494946.203717616,y=-2594300.23766366 for MEPS
lat=69,lon=18 is projected to x=8954720.907351136,y=1689422.3515892928 for AA
In this example we plot a timeseries for a single point, defined by its latitude and longitude. As the data is is stored on the x y grid, one approach is to find the nearest neighbour of our point in lon,lat on the x y grid.
import netCDF4
import pyproj
import numpy as np
import matplotlib.pyplot as plt

filename = "https://thredds.met.no/thredds/dodsC/mepslatest/meps_lagged_6_h_latest_2_5km_latest.nc"
ncfile   = netCDF4.Dataset(filename,"r")

print(ncfile.variables["projection_lambert"])
<class 'netCDF4._netCDF4.Variable'>
int32 projection_lambert()
grid_mapping_name: lambert_conformal_conic
standard_parallel: [63.3 63.3]
longitude_of_central_meridian: 15.0
latitude_of_projection_origin: 63.3
earth_radius: 6371000.0
proj4: +proj=lcc +lat_0=63.3 +lon_0=15 +lat_1=63.3 +lat_2=63.3 +no_defs +R=6.371e+06
unlimited dimensions:
current shape = ()
filling off
crs = pyproj.CRS.from_cf(
    {
        "grid_mapping_name": "lambert_conformal_conic",
        "standard_parallel": [63.3, 63.3],
        "longitude_of_central_meridian": 15.0,
        "latitude_of_projection_origin": 63.3,
        "earth_radius": 6371000.0,
    }
)
# Transformer to project from EPSG:4326 (WGS:84) to our lambert_conformal_conic
proj = pyproj.Proj.from_crs(4326, crs, always_xy=True)
# Compute projected coordinates of lat/lon point
lat = 60
lon = 10
X,Y = proj.transform(lon,lat)

# Find nearest neighbour
x = ncfile.variables["x"][:]
y = ncfile.variables["y"][:]

Ix = np.argmin(np.abs(x - X))
Iy = np.argmin(np.abs(y - Y))

ensemble_member = 0
times        = ncfile.variables["time"][:]
temperatures = ncfile.variables["air_temperature_2m"][:,0,ensemble_member,Iy,Ix]

plt.plot(times,temperatures);
plt.show()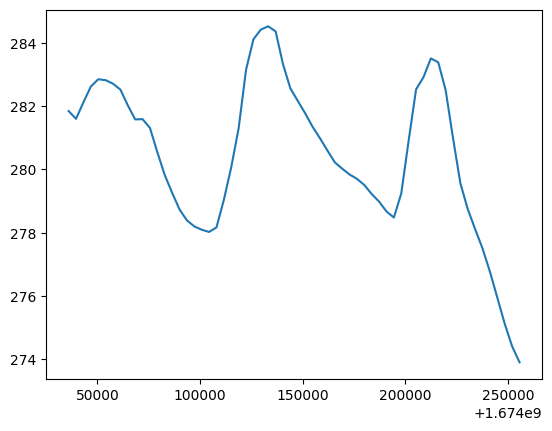
In this example we plot a timeseries for a single point, defined by its latitude and longitude, now using xarray. As the data is is stored on the x y grid, one approach is to first find the nearest neighbour of our point in lon,lat on the x y grid.
import xarray as xr
import pyproj

filename = "https://thredds.met.no/thredds/dodsC/mepslatest/meps_lagged_6_h_latest_2_5km_latest.nc"
ncfile = xr.open_dataset(filename)
print(ncfile.projection_lambert)
<xarray.DataArray 'projection_lambert' ()>
[1 values with dtype=int32]
Attributes:
grid_mapping_name: lambert_conformal_conic
standard_parallel: [63.3 63.3]
longitude_of_central_meridian: 15.0
latitude_of_projection_origin: 63.3
earth_radius: 6371000.0
proj4: +proj=lcc +lat_0=63.3 +lon_0=15 +lat_1=63...
crs = pyproj.CRS.from_cf(
    {
        "grid_mapping_name": "lambert_conformal_conic",
        "standard_parallel": [63.3, 63.3],
        "longitude_of_central_meridian": 15.0,
        "latitude_of_projection_origin": 63.3,
        "earth_radius": 6371000.0,
    }
)
# Transformer to project from EPSG:4326 (WGS:84) to our lambert_conformal_conic
proj = pyproj.Proj.from_crs(4326, crs, always_xy=True)
# Compute projected coordinates of lat/lon point
lat = 60
lon = 10
X,Y = proj.transform(lon,lat)

# Find nearest neighbour and plot directly
ensemble_member = 0
ncfile.air_temperature_2m.sel(x=X,y=Y,method="nearest").isel(ensemble_member=ensemble_member).plot();
This is an example recipe for the VC-files provided at thredds. The output will be a cross section with the vertical coordinate as one of the dimensions, or a vertical profile.
import xarray as xr
import matplotlib.pyplot as plt
DS = xr.open_dataset("https://thredds.met.no/thredds/dodsC/meps25epsarchive/"+\
                     "2020/09/29/meps_lagged_6_h_vc_2_5km_20200929T00Z.nc")

# Decode from Latin1 due to æ,ø,å characters and print all vcross
for name in DS.vcross_name.str.decode("latin1"):
    #print(name.values)
    pass
# Iterate through the names to search for stations we want
for nvcross, name in enumerate(DS.vcross_name.str.decode("latin1")):
# Convert from 0-sized array to scalar string to make searchable
scalar = str(name.values)
# Search with uppercase to prevent case sensitivity
if "Vadsø".upper() in scalar.upper():
print(nvcross,scalar)
if "ENZV".upper() in scalar.upper():
print(nvcross,scalar)122 ENJS-ENZV
126 SOLA/STAVANGER - 01415/ENZV
145 VADSØ - ENVD
It is important to note here that there are two types of vertical cross sections in the file: Route forecasts and vertical soundings: 145 VADSØ - ENVD (note here that ENVD is the ICAO-code of Vadsø airport, so this is not a route forecast) is a vertical "sounding", whilst 122 ENJS-ENZV is a route forecast (Johan Sverdrup to Sola). The difference is seen in the vcross_bnds variable:
# 122 ENJS-ENZV

nvcross = 122

xvals = DS.vcross_bnds.isel(nvcross=nvcross).values
# If not route-forecast, reduce list to scalar
if xvals[0] == xvals[1]:
    xvals = xvals[0]
print(xvals)
[27781 27851]
DS.air_temperature_ml.isel(x=xvals,ensemble_member=0,time=0).plot(y="hybrid")
plt.title("Route ENJS - ENZV")
plt.gca().invert_yaxis()
# 145 VADSØ - ENVD
nvcross = 145

xvals = DS.vcross_bnds.isel(nvcross=nvcross).values
# If not route-forecast, reduce list to scalar
if xvals[0] == xvals[1]:
    xvals = xvals[0]
print(xvals)
27874
DS.air_temperature_ml.isel(x=xvals,ensemble_member=0,time=0).plot(y="hybrid")
plt.title("Vertical profile - Vadsø airport - ENVD")
plt.gca().invert_yaxis()
In the files you might find wind vectors such as x_wind_10m, y_wind_10m, but you need the wind direction. The following python script calculates the local grid rotation (alpha) which may be used to calculate the wind direction.
import xarray as xr
import numpy as np
#******************************************************************************
# This routine calculates the local grid rotation (alpha) from input file,
# and writes to a separate output file.
# Formula:
#   alpha = atan2(dlatykm,dlonykm)*180/pi - 90)
#
# Wind direction relative to Earth (wdir) may later be calculated as follows:
#   wdir = alpha + 90-atan2(v,u)
# where u and v are model wind relative to model grid
#
#******************************************************************************

# In and outfiles
#url = "https://thredds.met.no/thredds/dodsC/mepsoldarchive/meps_det_extracted_2_5km_latest.nc"
infile = "https://thredds.met.no/thredds/dodsC/mepsoldarchive/"+\
         "2016/11/29/meps_subset_2_5km_20161129T00Z.nc"
outfile = "alpha.nc"

def distance(origin, destination):
    """
    (Source: https://stackoverflow.com/questions/19412462/
             getting-distance-between-two-points-based-on-latitude-longitude)

    Calculate the Haversine distance.

    Parameters
    ----------
    origin : tuple of float
        (lat, long)
    destination : tuple of float
        (lat, long)

    Returns
    -------
    distance_in_km : float

    Examples
    --------
    >>> origin = (48.1372, 11.5756)  # Munich
    >>> destination = (52.5186, 13.4083)  # Berlin
    >>> round(distance(origin, destination), 1)
    504.2
    """
    lat1, lon1 = origin
    lat2, lon2 = destination
    radius = 6371  # km

    dlat = np.radians(lat2 - lat1)
    dlon = np.radians(lon2 - lon1)
    a = (np.sin(dlat / 2) * np.sin(dlat / 2) +
         np.cos(np.radians(lat1)) * np.cos(np.radians(lat2)) *
         np.sin(dlon / 2) * np.sin(dlon / 2))
    c = 2 * np.arctan2(np.sqrt(a), np.sqrt(1 - a))
    d = radius * c

    return d

#*****************************************************************************

nc = xr.open_dataset(infile)

# Variables
xx = nc.x
yy = nc.y
lat = nc.latitude
lon = nc.longitude
alpha=lat #Target matrix

for j in range(0,yy.size-1):
    for i in range(0,xx.size-1):
        # Prevent out of bounds
        if j==yy.size-1:
            j1=j-1; j2=j
        else:
            j1=j; j2=j+1
        if i==xx.size-1:
            i1=i-1; i2=i
        else:
            i1=i; i2=i+1

        dlatykm=distance([lat[j1,i1],lon[j1,i1]],[lat[j2,i1],lon[j1,i1]])
        dlonykm=distance([lat[j1,i1],lon[j1,i1]],[lat[j1,i1],lon[j2,i1]])

        alpha[j,i]=np.arctan2(dlatykm,dlonykm)*180/np.pi - 90

# Make NetCDF file
rg = NetCDFFile(outfile, "w", format="NETCDF4")
x=rg.createDimension("x",xx.size)
y=rg.createDimension("y",yy.size)
alph=rg.createVariable("alpha","f4",("y","x"))
alph[:]=alpha
rg.close()Some files in e.g. AROME-Arctic det files have parameters on model levels, such as "air_temperature_ml". The height of the model level is usually derived from the parameter "geopotential_ml", but some times this parameter might not be available. In the following we explain how to calculate this yourselves from other information in the file.
The model level coordinate is a hybrid that follows the ground near bottom, and gradually converts to pressure level coordinates higher in the atmosphere.
The height of each model level depends on place and time (weather). Originally, the matter is made more complicated since the pressure is given on “half-levels” whereas T, u, v and q are on full levels; however, in the NetCDF output all parameters are given on full levels so we avoid this complication.
Nevertheless, thickness of a model level depends on air temperature and in the model output

Pressure on the different model levels is given by
then, taking
Then one must integrate from ground up, approximately assuming hydrostatic balance (dp/dz = -air density * g). The approximation of Z may be given by
where k is level number, R=287.058 J/kg⋅K (specific gas constant for dry air),
from netCDF4 import Dataset as ncfile
import numpy as np

opendap_prefix = "https://thredds.met.no/thredds/dodsC/aromearcticlatest/archive"
opendap_url = opendap_prefix + "/arome_arctic_det_2_5km_latest.nc"
# Use only time=0 to reduce the problem size
# Also ask for height0=0 to remove the 4th dimension in surface_air_pressure
with ncfile(opendap_url, 'r') as nc:
  nl = nc.dimensions['hybrid'].size
  ny = nc.dimensions['y'     ].size
  nx = nc.dimensions['x'     ].size

  ap   = nc.variables['ap'][:]
  b    = nc.variables['b' ][:]
  ps   = nc.variables['surface_air_pressure'][0,0,:,:]
  tair = nc.variables['air_temperature_ml'  ][0,:,:,:]
  qair = nc.variables['specific_humidity_ml'][0,:,:,:]

  t_virt = tair*(1 + 0.61*qair)

ap_half = [0.0]
b__half = [1.0]
for (ak,bk) in zip(ap[::-1], b[::-1]):
  ap_half.append(2*ak - ap_half[-1])
  b__half.append(2*bk - b__half[-1])

ap_half = np.array(ap_half)[::-1]
b__half = np.array(b__half)[::-1]

# Formula to calculate pressure from hybrid: p(n,k,j,i) = ap(k) + b(k)*ps(n,j,i)"
# Note that k = 0 is top of atmosphere (ToA), and k = 64 is the lowest model level
pressure_at_k_half = np.empty((nl+1,ny,nx), ps.dtype)
for l,ak,bk in zip(range(ap_half.size), ap_half, b__half):
  pressure_at_k_half[l,:,:] = ak + (bk*ps)

R = 287.058
g = 9.81

# Compute half-level heights
height_at_k_half = np.empty_like(pressure_at_k_half)
height_at_k_half[-1,:,:] = 0
for l in range(nl - 1, 0, -1):
  height_at_k_half[l,:,:] = height_at_k_half[l+1,:,:] + (R*t_virt[l,:,:]/g)*np.log(pressure_at_k_half[l+1,:,:]/pressure_at_k_half[l,:,:])

# Compute full-level heights
height_at_k      = np.empty_like(t_virt)
for l in range(nl - 1, 0, -1):
  height_at_k[l,:,:] = 0.5*(height_at_k_half[l+1,:,:] + height_at_k_half[l,:,:])

height_at_k[0,:,:] = height_at_k_half[1,:,:] + (R*t_virt[0,:,:]/g)*np.log(2)
Examples of the computed model level heights:
ToA:
Lowest model level: