-
Notifications
You must be signed in to change notification settings - Fork 807
Debugging
As of the 160407 release, the bridge offers improved Objective-C debugging with Visual Studio 2015 Update 3. The new debugging features are available in the debugger Locals and Watch windows, and they include:
- Breakpoints and stepping into, over and out of statements
- Objects expansion and inspection in the debugger Locals and Watch windows, with ivars visualization
- Support for the description and debugDescription methods in the debugger Locals and Watch windows
- Native visualizers for the NSNumber, NSString, NSArray and NSDictionary classes in the debugger Locals and Watch windows
- Ivars expression evaluation on the Watch window with arrow notation: myObject->myIvar
- Current selector display in the Locals window
- Objective-C language display in the Call Stack window
To enable the new features, you’ll need:
- Visual Studio 2015 Update 3, available here.
- The syntax highlighting Visual Studio extension, under bin/objc-syntax-highlighting in the SDK folder. Double click on it and follow the installation wizard to enable it.
- Symbols loading from the Microsoft Symbol Server. To enable it, follow the steps below. Please note that the files downloaded contain third party materials licensed under their terms in the Symbols Third Party Notices and Licenses section.
a. In Visual Studio, go to the Tools menu (1) and the Options… submenu (2).

b. On the left menu of the Options window, expand the Debugging section (1), select the Symbols subsection (2) and check the Microsoft Symbols Server checkbox (3).

c. Click OK (1) on the warning window that appears. It warns you that the debugging performance may vary since the symbols are loaded from an external server. Note that the debugging section will take a while to launch the first time after enabling symbols loading, since all the symbols will be downloaded. However, the debugging performance should improve on subsequent launches of your app.

d. Click OK (1) on the Options window to finish enabling the symbols loading.

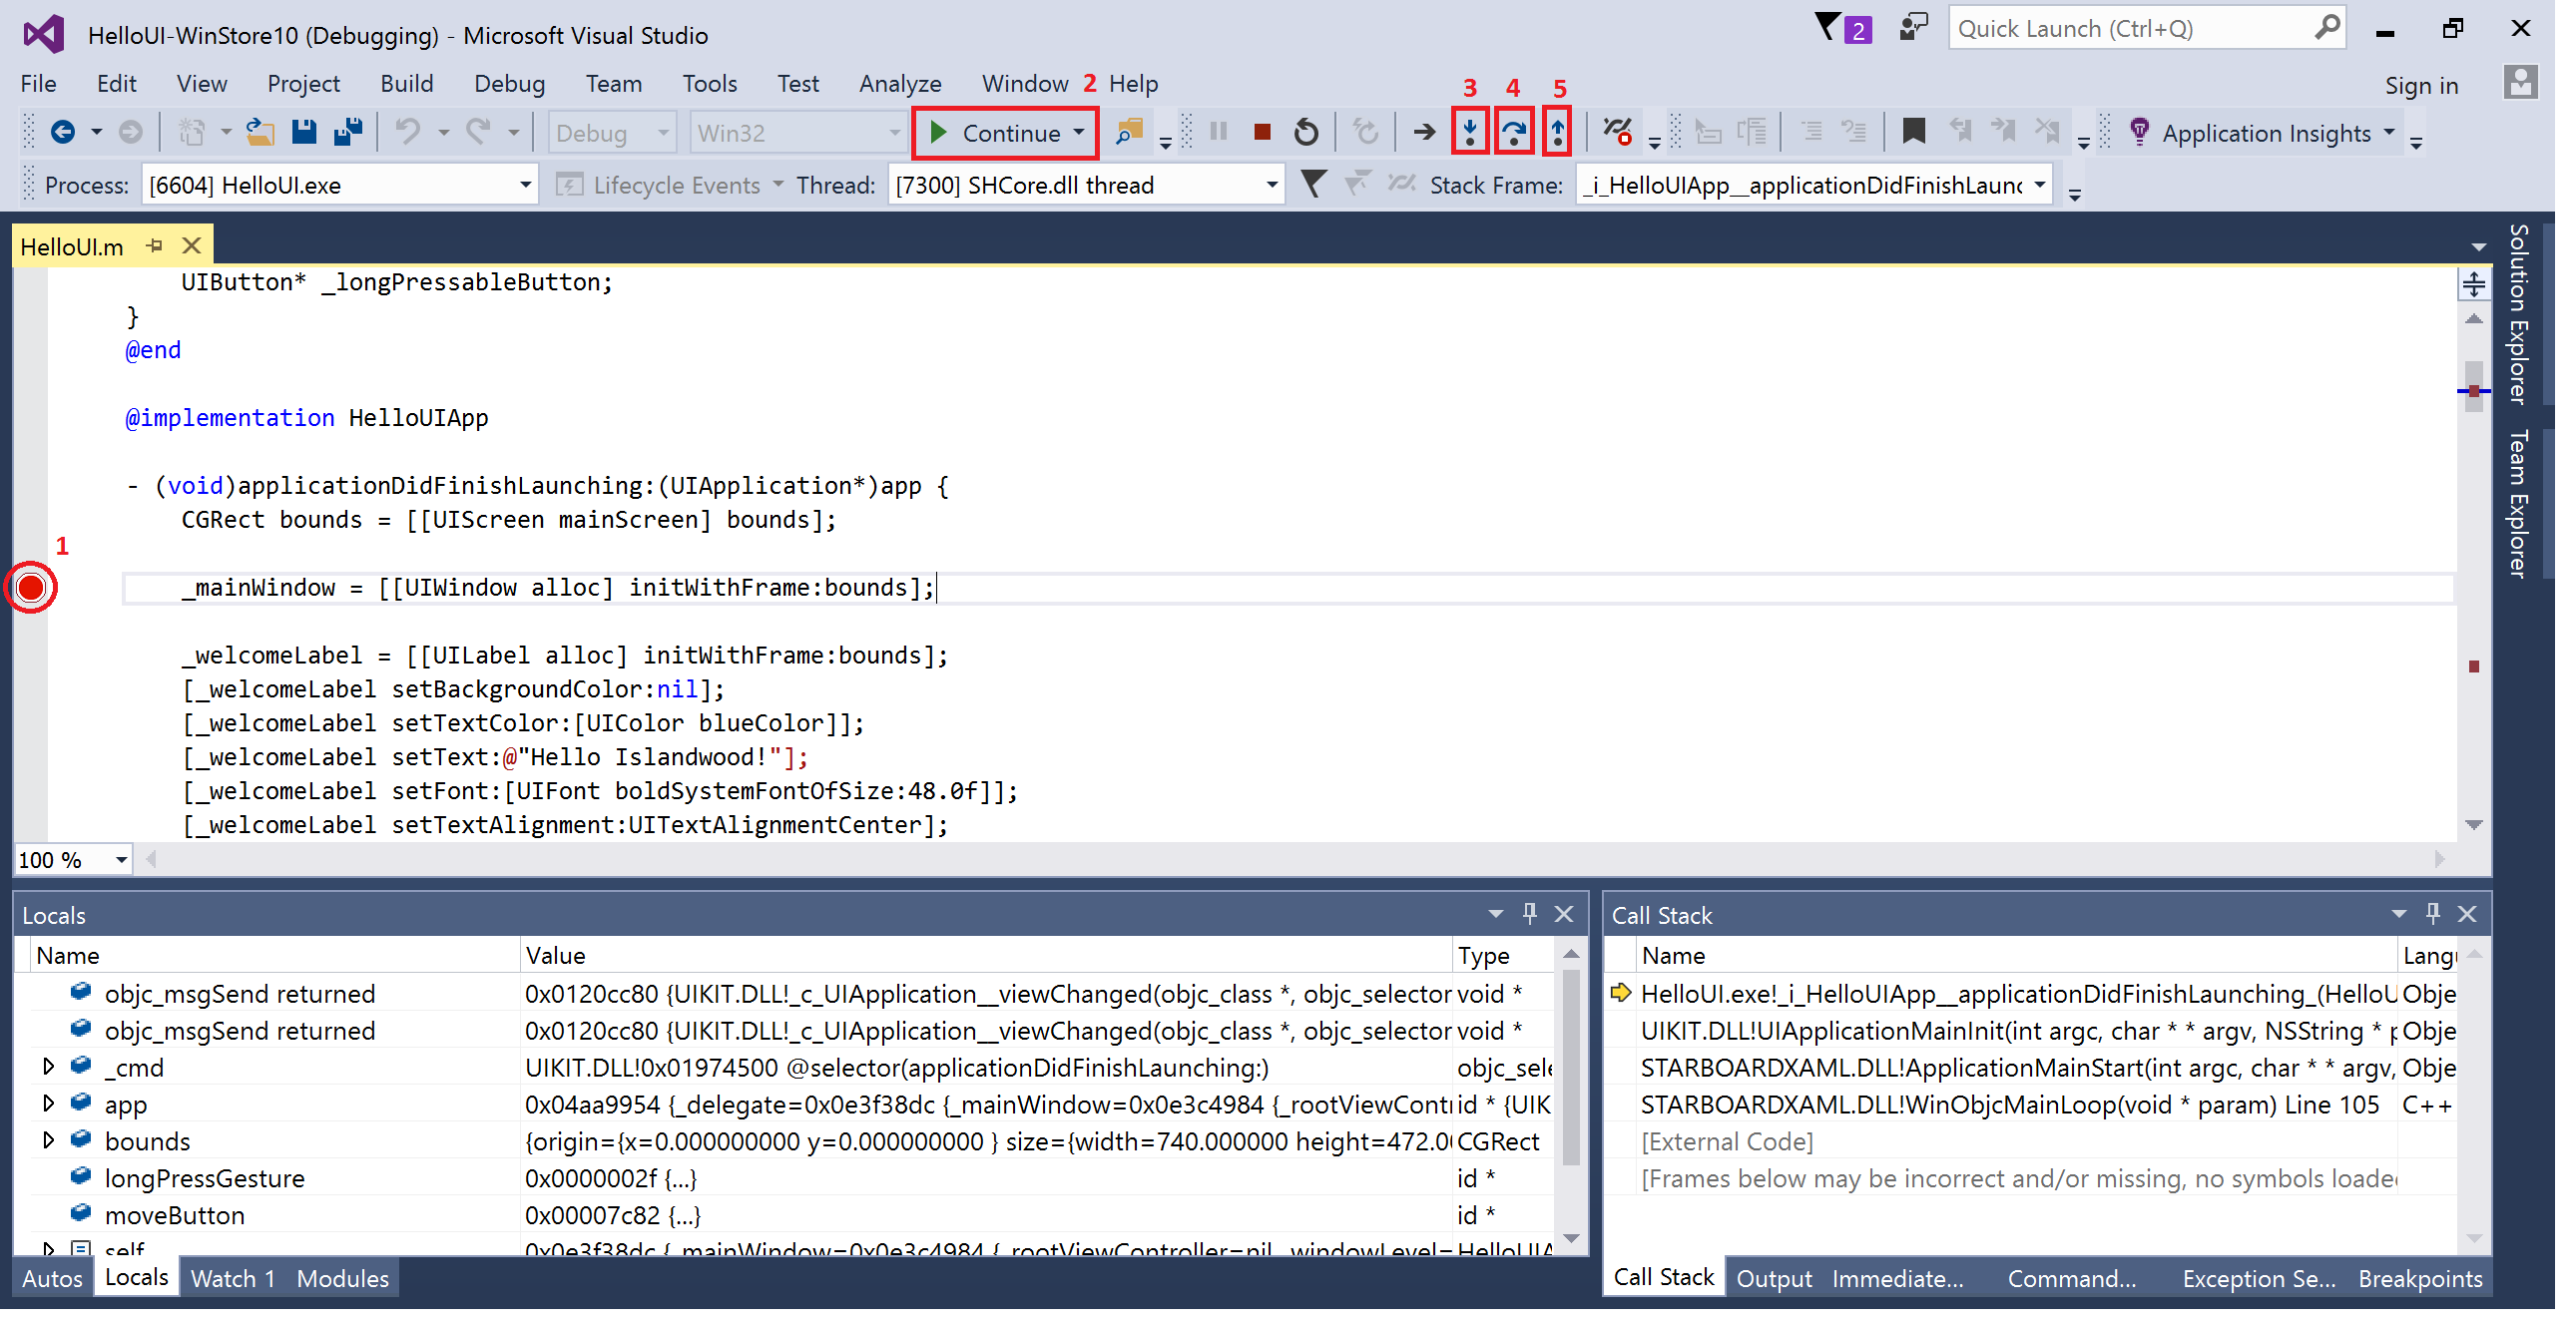
The bridge supports basic run-time debugging with breakpoints. To set a breakpoint, just click on the left sidebar (1) of the editor on the line that you want the execution of the application to pause. Once that’s done, re-run the application with debugging by pressing F5. When your breakpoint is hit, you can resume execution by clicking Continue (2) or, if you’d like to continue debugging, use the Step Into (3), Step Over (4) and Step Out (5) options.

While execution is paused debugging, you’ll notice that the current selector (1) is properly displayed in the Locals window (2). The Objective-C and Objective-C++ languages (3) are also properly recognized and displayed in the Call Stack window (4).

In the Locals and Watch windows, objects from Objective-C classes can be expanded and inspected (1), and their ivars and properties with backing ivars can be visualized (2).

The description and debugDescription methods are supported by the Locals and Watch windows. You can evaluate them by clicking on their corresponding refresh buttons (1) when expanding an object, and their result will be displayed in the Value column (2).


The NSNumber, NSString, NSArray and NSDictionary classes are properly displayed in the Locals and Watch window with native visualizers.

Besides being able to watch objects in the Watch window, you can also directly watch their ivars and properties backed by ivars by evaluating their expression with arrow notation. Note that dot notation (myObject.myProperty) and message expression evaluation ([myObject myProperty]) are not supported.

- The description and debugDescription methods don’t work for ARM debugging
- The inspection and expansion of Objective-C properties without backing ivars does not work
- Undefined ivars in the Watch window remain undefined after they are defined when you continue debugging, even if you refresh the Watch window entry or create a new one. A present workaround is to only evaluate ivars in the Watch window once they are defined.
Project
Using the bridge
- Getting Started
- Using vsimporter
- Using the SDK
- Building From Source
- Adding Objective C to an Existing Project
- UI Guidance
- Changing the SDK Version of a Project
- Debugging
- Debugging Stack Traces from Crash Dumps
- Supported Third Party Libraries
- Creating and Linking Against C++ Static Libraries
- Packaging
Samples and Tutorials
- Quick Start Tutorial
- Building a To-Do List App
- Building a Calculator App
- Mixing and Matching UIKit and XAML
- IOS Bridge Samples Repo
Contributing
Links