Skip to content
This repository has been archived by the owner on Jul 15, 2023. It is now read-only.

debug broken: vscode breakpoint set but not hit #1307

Closed
suntong opened this issue Oct 28, 2017 · 62 comments
Closed

debug broken: vscode breakpoint set but not hit #1307

suntong opened this issue Oct 28, 2017 · 62 comments

Comments

@suntong
Copy link

suntong commented Oct 28, 2017

Using the Go-latest.vsix as instructed at
#1203 (comment)
has caused my debugging not working any more -- I'm setting the break point at the first line in my main, but this is the only thing that I get (in the debug console):

ConfigurationDoneRequest
ContinueRequest
ContinueResponse
ThreadsRequest
2017/10/28 10:46:25 debugger.go:499: continuing
continue state {"Threads":null,"NextInProgress":false,"exited":true,"exitStatus":1,"When":""}
TerminatedEvent
DisconnectRequest

I.e., no break points works, and I simply cannot debug any more. Not using this Go-latest at least I can still do debugging. Is there any way I can go back?

Once again, all my own code are not under GOPATH, as I want to distinct my own code from those I get from go get. That was the reason vscode-go was confused about GOPATH before and it might still be the reason that my debugging is not working, because after carefully examine the debug console log, I saw:

Error on CreateBreakpoint: unknown file: /path/to/repo/gitwork/src/github.com/suntong/dnstools/cmd_probe.go
Error on CreateBreakpoint: unknown file: /path/to/repo/gitwork/src/github.com/suntong/dnstools/dnstools_main.go
All set:[null]
All set:[null]
SetBreakPointsResponse
...

However, under my normal file system, the files are just fine. E.g., both ls /path/to/repo/gitwork/src/github.com/suntong/dnstools/dnstools_main.go and file /path/to/repo/gitwork/src/github.com/suntong/dnstools/dnstools_main.go works just fine.

@ramya-rao-a
Copy link
Contributor

ramya-rao-a commented Oct 30, 2017

  • What is the version of VS Code you are using? The Go-latest.vsix needs VS Code 1.17.0 or higher.
  • Does debugging work when you pass the GOPATH in the env property in the debug configuration in the launch.json file?
  • The using GOPATH trace matches with your expected GOPATH?

Once again, all my own code are not under GOPATH, as I want to distinct my own code from those I get from go get

Here are you referring to the tools the Go extension depends on and downloads using go get? If yes, then you can use the go.toolsGopath setting to have a separate location to store all the dependent tools.

However, under my normal file system, the files are just fine. E.g., both ls /path/to/repo/gitwork/src/github.com/suntong/dnstools/dnstools_main.go and file /path/to/repo/gitwork/src/github.com/suntong/dnstools/dnstools_main.go works just fine.

Are these paths where the file physically resides or is it a symlink?

To go back to the old version, uninstall the Go extension and install it again from the marketplace.

@suntong
Copy link
Author

suntong commented Nov 1, 2017

Thanks ramya, I am able to go back to the old version as per your help and my debugging is now working.

I'll be out of town for a while and will get back to you for the rest when I'm back at the end of November. thx again.

@ramya-rao-a
Copy link
Contributor

@suntong I have published an update to the Go extension.
If you are not able to debug, then pass GOPATH via the env variable in the launch.json file.

Once you are back from your vacation, we can look into why you are not able to debug using the latest update

@suntong
Copy link
Author

suntong commented Dec 3, 2017

Hi @ramya-rao-a, the latest update of the Go extension is still unable to do debugging for me, with or without the GOPATH env variable in the launch.json file.

$ code --install-extension /tmp/Go-latest.vsix
Extension 'Go-latest.vsix' was successfully installed!

and I've just updated code to the latest version as well:

$ sudo dpkg -i /tmp/code_1.1*_amd64.deb
(Reading database ... 158741 files and directories currently installed.)
Preparing to unpack .../code_1.18.1-1510857349_amd64.deb ...
Unpacking code (1.18.1-1510857349) over (1.17.0-1507160143) ...
Setting up code (1.18.1-1510857349) ...
Processing triggers for desktop-file-utils (0.23-1ubuntu2) ...
Processing triggers for bamfdaemon (0.5.3+17.04.20170406-0ubuntu1) ...
Rebuilding /usr/share/applications/bamf-2.index...
Processing triggers for mime-support (3.60ubuntu1) ...

@suntong
Copy link
Author

suntong commented Dec 3, 2017

Oh, I was able to go back to the old version as per your help and my debugging was working before, but now, having uninstalled the Go extension and installed it again from the marketplace, I'm still unable to do debugging any more. :(

@suntong
Copy link
Author

suntong commented Dec 3, 2017

@ramya-rao-a, I lost track what was working before, but would it be possible for me to go back to the Go extension version that has been working for me before please?

@ramya-rao-a
Copy link
Contributor

You can always go back to the version you want by getting the vsix file from the Releases tab

Find the release you want, there should be a vsix file that you can download.

Also add the setting "extensions.autoUpdate": false else, the extension will get auto-updated the next time you reload VS Code.

If you pass GOPATH from the launch.json it should definitely get picked up.

Since I cannot repro your issue, I dont know where to begin with to fix the issue for you.
The best approach right now is to help you debug the Go extension and see what GOPATH is being used and if that's the right one or not.

If you are up for it when you have some time, then follow the steps at Building and Debugging the Go extension

Then, add a breakpoint at https://github.com/Microsoft/vscode-go/blob/0.6.69/src/goDebugConfiguration.ts#L48. That's the debug config from the launch.json file.

@suntong
Copy link
Author

suntong commented Dec 5, 2017

Thanks for the reply @ramya-rao-a,

I thought it was my own problem so I tried it from an entirely different system, but I'm not able to debug there either.

I reverted from Go-0.6.69.vsix, one by one, from Go-0.6.67.vsix all the way to Go-0.6.65.vsix, which need to set GOPATH, but am sill not able to debug any more. I think the latest VS Code no longer works with older go plugins.

So, @ramya-rao-a, please try to download the code https://github.com/suntong/hello-world-go into /tmp/hello-world-go, and try debug there, would you be able to debug there? Thanks

@ramya-rao-a
Copy link
Contributor

I think the latest VS Code no longer works with older go plugins.

That's right. The older debug APIs were deprecated in VS Code 1.18. So debugging using older Go extensions in VS Code 1.18 is not possible.

please try to download the code https://github.com/suntong/hello-world-go into /tmp/hello-world-go, and try debug there

And what should be the GOPATH in this case? Are you able to repro the issue without symlinks?

Can you follow the steps in #1307 (comment) and see why the GOPATH from your launch.json is not getting passed?

@suntong
Copy link
Author

suntong commented Dec 5, 2017

The thing is, the problem is not because of symlinks, it "fails regardless of the symlinks"
(#1203 (comment)).
The real cause is:

all my own code are not under GOPATH

So, yes, I am able to repro the issue without symlinks. Trying it for yourself as above.

what should be the GOPATH in this case?

Whatever you defined in the environment variable, which should be picked up by vscode-go out of the box. I.e., it is unrelated to the GOPATH setting.

see why the GOPATH from your launch.json is not getting passed

The GOPATH is fine and no longer an issue since #1203 (comment), and it was never a problem to me as "after adding the GOPATH as an env var in the env property in the launch.json file solved the problem" #1203 (comment)

So please try it out as I proposed, and see what you get. Thanks.

@ramya-rao-a
Copy link
Contributor

ramya-rao-a commented Dec 6, 2017

please try to download the code https://github.com/suntong/hello-world-go into /tmp/hello-world-go, and try debug there

When I tried this using the default debug config from launch.json, the program ran successfully, but the breakpoints were not hit.
screen shot 2017-12-05 at 9 40 06 pm

Further, after adding "trace": "verbose", I can see the unknown file: /private/tmp/hello-world-go/main.go as error message when the delve tries to create the breakpoint

screen shot 2017-12-05 at 9 42 05 pm

Is this the same that you see?

@suntong
Copy link
Author

suntong commented Dec 6, 2017

Oh, yeah, exactly!

What you've described the two observations are exactly the same as what I'm getting.

Two more things to add,

  • my launch.json was only created once by vscode-go, which shows up within "Explorer" under "MyNname" > .vscode > launch.json, instead of under each project (even after I've deleted it and trying to recreate it again under different projects). As the result, I'm getting such "Error on CreateBreakpoint: unknown file: " errors in the debug output on whatever projects I've been working with. I.e., that error is a huge list not only limited to this little project that I'm working on.
  • using delve directly works just fine. So my conclusion is that the problem is something internal within vscode-go.

@mmcmm
Copy link

mmcmm commented Dec 7, 2017

Yes, I had the same problem, breakpoints not getting hit, although I now it seems to be working.

@selam
Copy link

selam commented Dec 8, 2017

hello, we have same problem (my team) on Mac Os X, delve version: 1.0.0-rc.2, vscode version 1.18.1, i try with vscode-go with 0.0.66 and start working again, if i try never versions of vscode-go extension stop working

@ramya-rao-a
Copy link
Contributor

@suntong Weirdly if I clone your example (or any simple single page program) to some other folder (not under /tmp) I don't see the issue. Do you specifically use /tmp or does this issue occur no matter what the folder is?

@selam Is your case the same? i.e code not under $GOPATH and under /tmp?

@selam
Copy link

selam commented Dec 9, 2017

@ramya-rao-a not really the same case, my code in $GOPATH but error was same.

first error was "file not found" i downgrade, upgrade delve versions then error message changed to "unkown file" instead of "file not found", then i try different versions of vscode-go extension, now delve version 1.0.0-rc2 and vscode-go 0.0.66 and works like a charm

@suntong
Copy link
Author

suntong commented Dec 9, 2017

@selam thanks for the update and clarification. (I tried Go-0.6.69.vsix, Go-0.6.67.vsix then Go-0.6.65.vsix, all not working. I.e., I skipped the working vscode-go 0.0.66 version, :-( )

@ramya-rao-a
no, this issue occurs no matter what the folder is. Mine is not under /tmp, and as @selam's case, it doesn't even matter whether it is under $GOPATH or not.

@suntong suntong changed the title Go-latest is causing my debugging not working any more Latest vscode-go stopped my debugging from working any more Dec 9, 2017
@ramya-rao-a ramya-rao-a changed the title Latest vscode-go stopped my debugging from working any more unknown file error when creating breakpoint Dec 10, 2017
@ramya-rao-a
Copy link
Contributor

ramya-rao-a commented Dec 10, 2017

Now I am not able to repro!! Am using the same cloned repo, VS Code version, delve version and Go extension version as when I did get a repro as mentioned in #1307 (comment)

@suntong @selam Can you tell me using "trace": "verbose", if the GOPATH printed to the debug console when you pass the GOPATH as env var in the debug config vs when you don't pass the GOPATH as env var in the debug config are the same or not?

Also, in the debug configuration that you are using, what is the value for program?

@ramya-rao-a
Copy link
Contributor

@selam, @suntong,

I compared the debugging related code of the extension between the versions 0.6.66 and the latest 0.6.69. The only difference is the GOPATH being used by the debug process

In 0.6.66:

  • If GOPATH was passed in the debug config, then that is used
  • Else if GOPATH was set as env var outside VS Code and the path in the program attribute in the debug config falls under this GOPATH, then that is used
  • Else we infer the GOPATH from the path in the program attribute in the debug config. For eg: if the path is /Users/me/src/github.com/myproject/main.go, then the GOPATH is inferred to be /Users/me

In 0.6.69:

  • If GOPATH was passed in the debug config, then that is used as before
  • Else if the command Go: Current GOPATH is returns any GOPATH, then that is used
  • Else we infer the GOPATH from the path in the program attribute in the debug config as described before

So based on this, here are my follow up questions:

  • When using the latest Go extension, is the GOPATH printed to the debug console when you pass GOPATH as env var in the debug config different from the one printed when you don't pass it as env var?
  • In both above cases, compare the GOPATH printed in the debug console with what you get by running the command Go: Current GOPATH
  • Have you enabled the go.inferGopath setting?
  • What is the path of the main folder opened in VS Code?
  • What is the value of the program attribute in the debug config?

@suntong suntong changed the title unknown file error when creating breakpoint debug broken: unknown file error when creating breakpoint Dec 10, 2017
@suntong
Copy link
Author

suntong commented Dec 10, 2017

Hi @ramya-rao-a,

I'll answer your questions at the end of this message, but

First of all, I changed the title to reflect the problem's external behavior instead of internal manifesting so end users who are looking for the answer know this is* the one that they are after.

Now,

  • Please tell us exactly which the versions you are using, the VS Code version, delve version and Go extension version, etc, etc, that everything you can think of that relate around the debugging.
  • You said the debugging broke only under /tmp, now you are saying you are not able to repro any more. Does it mean even the /tmp is working for you? If so, what changes you have make to cause this?
  • If you can't think of any changes that so significantly impact the debugging behavior, then it is the problem of internal inconsistency of vscode-go, that will behavior differently even when everything are the same. This should be the focus of your exploring path, because you have experienced first hand of such inconsistency, and only you have seen the behavior of both sides, whereas for me, I'm always seeing the failing side.
  • everything must have a reason, but if you really cant' think of any, then please follow @selam's experiment:

first error was "file not found" i downgrade, upgrade delve versions then error message changed to "unkown file" instead of "file not found"

and see if you can duplicate the inconsistency of above behavior, which might give you a further clue.

All that I'm saying is, try to go back to when debugging was failing for you. If you are absolutely sure there is nothing changed on your side, between then and now, then the inconsistency behavior is beyond everything that you are comparing. I.e., what you were looking at were not the cause -- it is something that you have not payed attention to that is causing such inconsistency.

Just for an example, the differences between version of github.com/uudashr/gopkgs/cmd might be the cause, (just for e.g., which might not be), i.e. if you think it is the version problem, then you need to tell us exactly which the versions you are using of everything that relate around the debugging, which you are the domain expert on that. Hint: have you thought of your OS?.

My advice, If you really can't think of anything that impact the debugging behavior, then don't touch your current environment, and start everything afresh. That's what I did:

I thought it was my own problem so I tried it from an entirely different system, but I'm not able to debug there either.

I installed my Ubuntu 17.04 in a brand new VM, and installed everything that relate around the debugging afresh, i.e., to there latest version. Yet, the debugging is failing in that case. Please try this (start everything afresh), and if it works for you, please tell us exactly which the versions you are using for everything that relate around the debugging, and I can compare it to mine.

Now, I don't think the following answer matters, but since you asked...
hm, let me put them in a new comment...

@suntong
Copy link
Author

suntong commented Dec 10, 2017

Answering your questions,

  • When using the latest Go extension, is the GOPATH printed to the debug console when you pass GOPATH as env var in the debug config different from the one printed when you don't pass it as env var? What printed in the debug console of Using GOPATH: are exactly the same regardless whether passed as env var or not, which are the same as my shell var.
  • In both above cases, compare the GOPATH printed in the debug console with what you get by running the command Go: Current GOPATH? Press Ctrl+Shift+P then Type Go: Current Gopath or select it from the options, the results are exactly the same regardless whether passed as env var or not, which are the same as my shell var.
  • Have you enabled the go.inferGopath setting? No.
  • What is the value of the program attribute in the debug config? "program": "${fileDirname}"

What is the path of the main folder opened in VS Code? /path/to/src/github.com/suntong/hello-world-go, but please also note,

my launch.json was only created once by vscode-go, which shows up within "Explorer" under "MyNname" > .vscode > launch.json, instead of under each project (even after I've deleted it and trying to recreate it again under different projects). As the result, I'm getting such "Error on CreateBreakpoint: unknown file: " errors in the debug output on whatever projects I've been working with. I.e., that error is a huge list not only limited to this little project that I'm working on.

@ramya-rao-a
Copy link
Contributor

@suntong First off, thanks for your patience

You said the debugging broke only under /tmp, now you are saying you are not able to repro any more. Does it mean even the /tmp is working for you? If so, what changes you have make to cause this?

I am using Go 1.9.2 in Mac OS X Yosemite with delve 1.0.0-rc.1 installed via home-brew: No changes were made to these
I work on and off on both VS Code 1.18.1 (stable build) and VS Code 1.19-Insiders (which gets updated every night) using the latest version of the Go extension on both.

When debugging broke for me as described in #1307 (comment), I don't recall if I was using the VS Code 1.18.1 or 1.19-Insiders

When I couldn't get a repro yesterday as I mentioned in #1307 (comment), I don't recall if I was using VS Code 1.18.1 or 1.19-Insiders

Right now, debugging is broken for me (when using /tmp) in my Mac OS OX VS Code 1.18.1 but not in 1.19-Insiders.
Debugging works fine in both VS Code 1.18.1 and Insiders if the code is not under /tmp

My advice, If you really can't think of anything that impact the debugging behavior, then don't touch your current environment, and start everything afresh.

From your answers to my questions, I really can't think of any changes made post 0.6.66 that can impact debugging.

I started fresh and I still cannot repro the issue. Here are my steps:

  • Fresh new parallel using Ubuntu 14.04 in my Mac OS X Yosemite
  • Installed go 1.9.2 and by default GOPATH would be /home/parallels/go
  • Cloned your sample repo http://github.com/suntong/hello-world-go under /tmp and opened it in VS Code 1.18.1
  • Installed Go extension and installed all Go tools using the Go: Install/Update Tools. This installs delve from the master branch with version 1.0.0-rc.2
  • Opened main.go file, created breakpoint, press F5: Breakpoint is hit successfully. No launch.json file created
  • Deleted the debug binary that got created in the previous step.
  • Pressed the gear icon in the debug viewlet that creates a launch.json file with default debug config where program points to ${fileDirname}
  • Opened main.go file, created breakpoint, press F5: Breakpoint is hit successfully.
  • Downgraded delve to 1.0.0-rc.1 (by creating a branch from derekparker/delve@f609169 and running go install github.com/derekparker/delve/cmd/dlv) => everything works
  • Upgraded delve to 1.0.0-rc.2 (by creating a branch from derekparker/delve@a7d1797 and running go install github.com/derekparker/delve/cmd/dlv) => everything works

@ramya-rao-a
Copy link
Contributor

@suntong

So summary from previous comment is that I can repro the issue only when code is under /tmp (other places are fine) and when using VS Code 1.18.1 (Insiders is fine) with latest Go extension on my Mac OS X (Ubuntu 14.04 in parallel is fine)

Can you try on VS Code Insiders? You can get it from https://code.visualstudio.com/insiders

@suntong
Copy link
Author

suntong commented Dec 11, 2017

Thanks for the swift update, and detailed steps in how to get things going the proper way, which is most valuable to me.

I'll find some time to try the VS Code Insiders, and the detailed steps you outlined above, then get back to you...

@ramya-rao-a
Copy link
Contributor

Also, no issues in Windows either

@suntong
Copy link
Author

suntong commented Dec 14, 2017

I get it working @ramya-rao-a!!!

Thanks a lot for your detailed steps, without which I'll surely be lost along the path.
Thank you, THANK YOU!

Although, I wasn't able to make it work at first no matter what, when I was opening/using my code from my /path/to/src/github.com/suntong/hello-world-go. Then I copied it to under /tmp, and it works there. Then I went back to my /path/to/src/github.com/suntong/hello-world-go and tried again, and strangely, it worked as well. I didn't do anything differently! Just that every time before I try, I "delete the debug binary that got created in the previous step" (thanks for that tip!).

I'm so happy now. Thanks again!

@suntong
Copy link
Author

suntong commented Dec 16, 2017

hmm, never used gophers slack before, any url that I can ready about how to use it?
and what's your id on gophers slack so that I can contact you once I'm in?

@ramya-rao-a
Copy link
Contributor

You can join at https://invite.slack.golangbridge.org. You can look for "Ramya Rao" there.

@suntong
Copy link
Author

suntong commented Dec 16, 2017

Joined.

I tried at my side -- no matter how I start code, of all methods in your chart, breakpoint was not hit except the one under \tmp (which will always hit no matter how I start code). That includes clicking the "Recent" items when starting code in different ways. Nothing works except the one under \tmp (always work no matter how reach there, from start or clicking on the "Recent" items).

In all cases where breakpoint was not hit, the log for debugger.go:97: launching process with args: had the correct path where my code is. Same for the working one under \tmp:

2017/12/16 09:49:58 debugger.go:96: launching process with args: [/tmp/hw-go/debug Mr Smith]

@suntong
Copy link
Author

suntong commented Dec 16, 2017

Again, where does vscode cache its settings? as whenever I open my code from code, I can see my break-point being set -- this info is not kept in .vscode/launch.json, so where is it kept? I think something wrong there.

@suntong
Copy link
Author

suntong commented Dec 16, 2017

@ramya-rao-a, is your /tmp somehow a symlink?

I think I've found the real cause why /tmp is working for me whereas everything else are not. Let me list the fact first (of duplicating my /tmp/hw-go/ into different places):

  • /tmp/hw-go/, works, known before.
  • /path/to/src/github.com/suntong/hello-world-go, not working, known before.
  • /tmp/hwg2, still works, no matter what.
  • ~/Public/hwg3, no longer working, no matter what.
  • /other/path/to/workv/save/hwg3, works, no matter what.

So what the difference between /other/path/to/workv/save/hwg3 & ~/Public/hwg3, i.e. those working and those not? --

  • All those that works, their path are real path. I.e.,
  • All those that do not work, their path are not real path, i.e., there are symlinks somewhere alone the path.

Here is proof:

cd /tmp
# -- that's where my *working* code (/tmp/hw-go/) is. Change to yours (above, and below for `../hw-go/`)
mkdir d1
ln -s d1 d2
cd d2
cp -a ../hw-go/ hwg3
cd hwg3/
code `pwd` &

After this, break-point is not working any more, despite being under /tmp.

Now watch:

:/tmp/d2/hwg3$ realpath . 
/tmp/d1/hwg3

cd /tmp/d1/hwg3
code `pwd` &

It works again.

So, this is proof (to me) that, if there are any symlinks somewhere alone the path, vscode break-point will no longer works.

@suntong suntong changed the title debug broken: unknown file error when creating breakpoint debug broken: vscode breakpoint set but not hit Dec 16, 2017
@denismp
Copy link

denismp commented Mar 22, 2018

I upgraded to 1.22.0, now it says the the breakpoint is ignored because generated code not found(source map problem?). BTW, I am writing angular 2 code.

@ramya-rao-a
Copy link
Contributor

@denismp This is the extension for Golang, please log your issues with angular code in either the extension you use for angular or in the main vscode repo

@RajatBanerjee
Copy link

any update on this ? I still get
Error on CreateBreakpoint: could not find $GOPATH/src/githubfolder/myfolder/file.go
vscode :1.22
vscode-go :0.6.78 - 3rd April, 2018

@RajatBanerjee
Copy link

RajatBanerjee commented Apr 23, 2018

any update on this @ramya-rao-a ?
i get the same error on
VScode:1.22
vscode-go : 0.6.78 - 3rd April, 2018

Error on CreateBreakpoint: could not find /Users/rbanerjee/go/src/github.xyz.corp/lumen/project/resolver.go:33

debug config:
"configurations": [
{
"name": "Launch",
"type": "go",
"request": "launch",
"mode": "debug",
"remotePath": "",
"port": 2345,
"host": "127.0.0.1",
"program": "${workspaceRoot}/main.go",
"env": {
"GOPATH":"/Users/rbanerjee/go"
},
"args": [],
"showLog": true,
"trace": "verbose"
}

@buzzdan
Copy link

buzzdan commented May 31, 2018

any news on this issue ? still cant debug

@fcelda
Copy link

fcelda commented Jun 1, 2018

I have a similar problem and by trial and error I found out that this might indeed be caused by symlinks.

In my case, I have a symlink in GOPATH that points to sources that are checked out somewhere else. Whenever I place breakpoint to a symbol in a package within this path containing symlink, it will appear as unverified breakpoint in VSCode.

This is the setup:

  • GOPATH: ~/devel/go
  • sources: ~/company/repo
  • symlink: ~/devel/go/src/github.com/company/repo -> ~/company/repo

If I remove the symlink and move the sources into GOPATH, the problem disappears.

JFTR, setting the breakpoints via Delve works even with the symlink.

@suntong
Copy link
Author

suntong commented Jun 1, 2018

Thanks a lot Jan @fcelda, for going a long way proving it. and Yes, I found Delve works even with the symlink too.

So @ramya-rao-a, it is now a confirmed case, with confirmed reason, I believe.
Moreover, I believe that @denismp's case is caused by the same reason as well, I.e., not only related/ caused-by the extension for Golang.

@arkanmgerges
Copy link

arkanmgerges commented Jun 24, 2018

Hi,
I'm using vscode insiders version 1.25.0-insider
golang 1.10.1
dlv is installed.
os : ubuntu 18
I could not hit the the breakpoint for any other project, even the hello world that is discussed on this page, and I even had tried VSCode (not insider) and also I could not hit the breakpoints.
I moved the code to /tmp and it did not work (the code work, but I mean it did not hit the break point)
I tried the code in ~/go/src/...etc and it did not work (I'm referring to the breakpoint)
I tried from other places and it did not hit the breakpoint

I don't know what is the problem

This is just an example taken from y debug console (trace: verbose is set)

Verbose logs are written to:
/tmp/vscode-go-debug.txt
3:06:47 PM, 6/24/2018
InitializeRequest
InitializeResponse
Using GOPATH: /home/arkan/go
Running: /home/arkan/go/bin/dlv debug --headless=true --listen=127.0.0.1:2345 --log=true --
time="2018-06-24T15:06:47+03:00" level=info msg="launching process with args: [/tmp/delve-crash/app/debug]" layer=debugger

@suntong
Copy link
Author

suntong commented Jun 24, 2018

That's very frustrating indeed.
It baffles me that why nobody cares to look into it, after it has been reported for so long, and even after the exact simple steps to duplicate the problem has been given, and it clearly is affecting everyone.
So currently MS VS Code is literately useless to the entirely Go community, and beyond, e.g., the angular 2 code that @denismp's writing, yet the Microsoft VS Code developers don't even give it a damn. Fantastic.

@arkanmgerges
Copy link

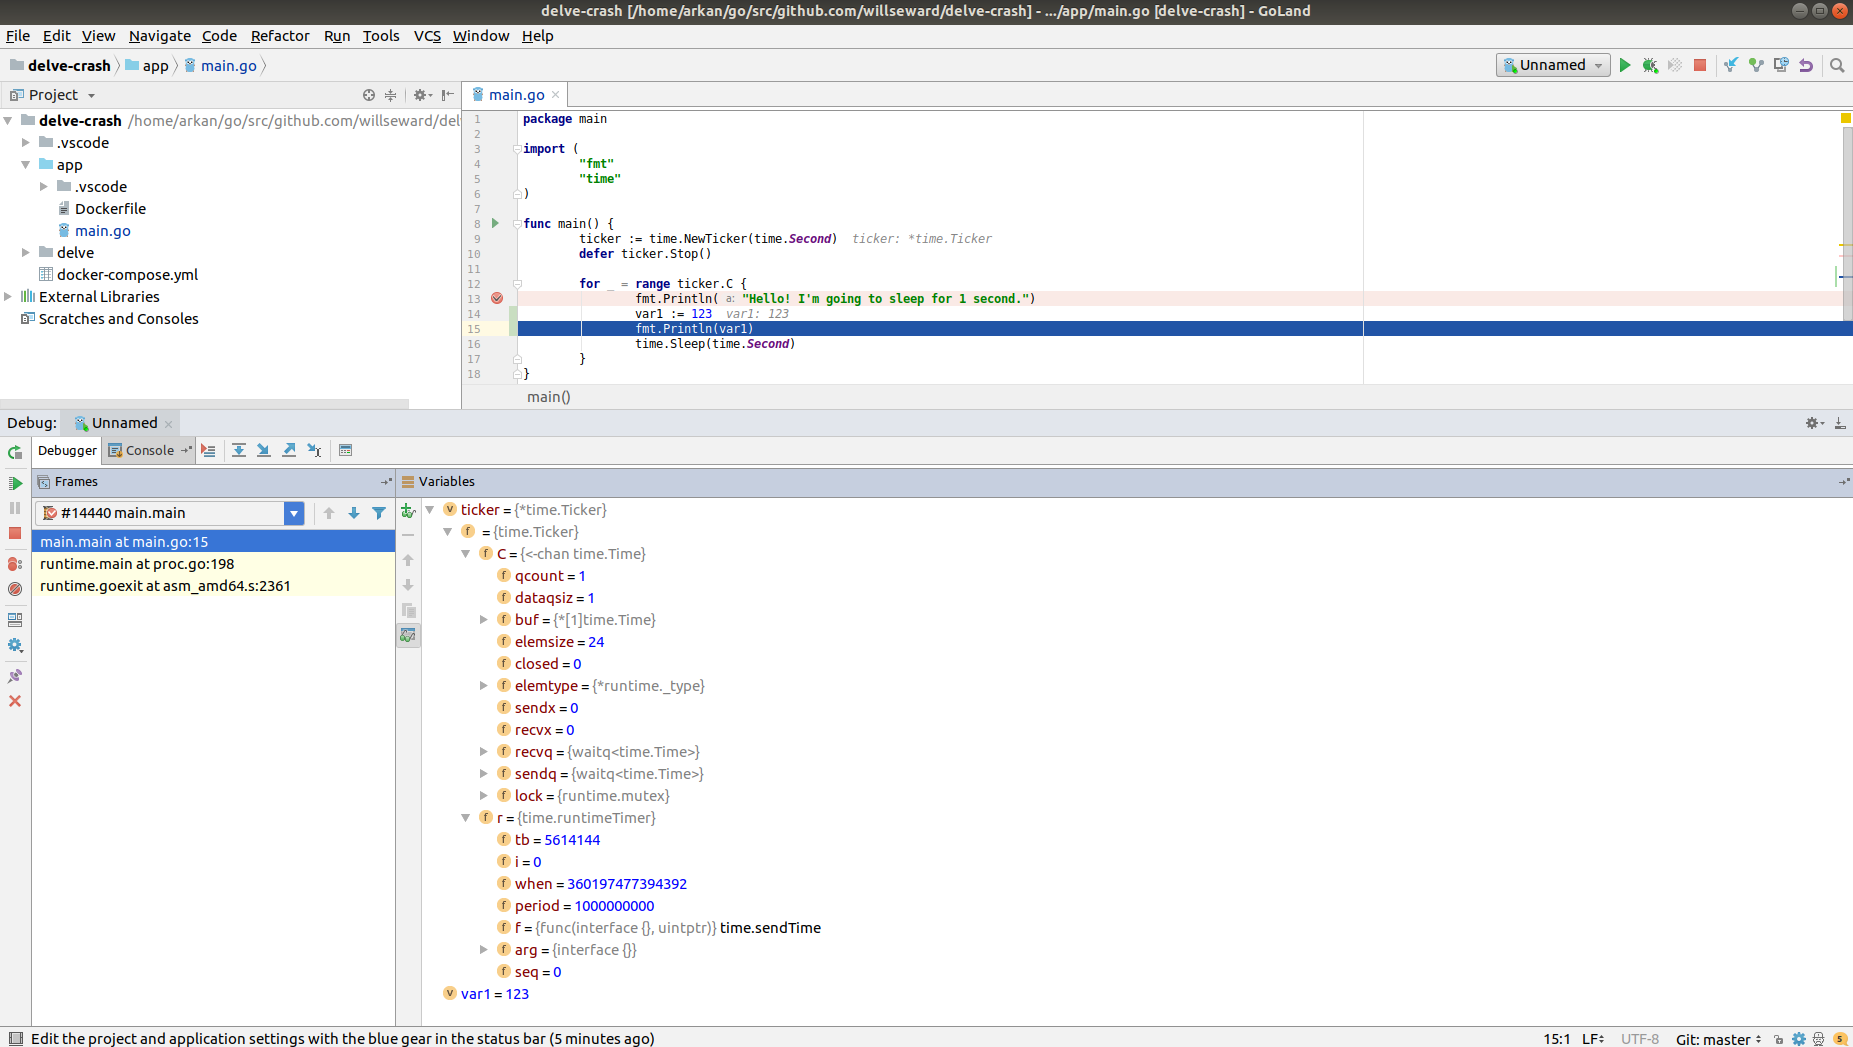
Sorry to mention here, but I've tested goland from intellij and it worked, I can debug the code without any problem.
I'm not making any ads, or something, but MS VSCode team needs to put more efforts on this
I think VS Code needs more attention.

Best regards

goland_test

@ramya-rao-a
Copy link
Contributor

ramya-rao-a commented Jun 29, 2018

@RajatBanerjee Sorry for not replying sooner, somehow the notification for this issue got lost in a sea of other notifications. Do you use symlinks as well?

@arkanmgerges Looking at the logs you posted, your issue seems to be different from the one being discussed here and more likely related to #1752 which in turn was due to an upstream change in delve.
Please update your version of the delve which fixes #1752

@fcelda Thanks for confirming that there are no issues when there are no symlinks

@suntong

That's very frustrating indeed.
It baffles me that why nobody cares to look into it, after it has been reported for so long, and even after the exact simple steps to duplicate the problem has been given, and it clearly is affecting everyone.
So currently MS VS Code is literately useless to the entirely Go community, and beyond, e.g., the angular 2 code that @denismp's writing, yet the Microsoft VS Code developers don't even give it a damn. Fantastic.

Please understand that I am the sole maintainer of this open source project and its not my full time job. So when there is an issue that I cannot repro even after all my efforts thats clearly documented above, there is nothing else I can do other than do a live debugging session via slack or other means. Which I did offer, and I didnt hear from you on slack or gitter. The offer still stands for you and the others on this thread, though not for the coming week as I am out on vacation.

Also, I refuse to accept the claim that this is affecting everyone. This issue is very specific to users who use symlinks as you have already concluded.

The angular issue could be due to a variety of unrelated reasons which is best resolved by logging an issue in the VS Code repo. And we dont know if @denismp has already done so and gotten the issue resolved. So please dont equate the two.

@suntong
Copy link
Author

suntong commented Jun 29, 2018

@ramya-rao-a, thanks for the clarification.

My point is, it might most likely not your code problem at all. Ref again the angular 2 code that @denismp's writing. I.e., the fault resides beyond the scope of vscode-go.

@inancgumus
Copy link

Take a look at this simple program.

If you put a breakpoint on the lines that I've commented below as NEVER HIT. Delve never hits.

However, when you put it to the other lines as commented as HITS, then it hits those lines.

You may having a problem like this. Let you know...

package main // NEVER HITS
// NEVER HITS
import (  // NEVER HITS
	"fmt"  // NEVER HITS
) // NEVER HITS
// NEVER HITS
func main() { // HITS
	var ( // NEVER HITS
		sum int // HITS
		i   = 1 // HITS
	) // NEVER HITS
 // NEVER HITS
	fmt.Println(sum, i) // HITS
}

@ravirakesh
Copy link

ramya-rao-a:-
Hi,
I have go lang application working in docker with delve entry-point but getting response from vs code but break point not working properly its disable.

@ramya-rao-a
Copy link
Contributor

@ravirakesh You are attempting to do remote debugging, please log a separate issue for that. In the new issue, provide the debug configuration using. Also add "trace": "verbose" to your debug config. That will print logs in the debug console, share that as well, but in a separate new issue

@ravidborse
Copy link

@ramya-rao-a
Getting Error

Error on CreateBreakpoint: could not find C:\Users\raborse\go\src\RestAPI\main.go:7

Verbose logs are written to: C:\Users\raborse\AppData\Local\Temp\vscode-go-debug.txt 2019-2-9, 18:29:27.904 UTC From client: initialize({"clientID":"vscode","clientName":"Visual Studio Code","adapterID":"go","pathFormat":"path","linesStartAt1":true,"columnsStartAt1":true,"supportsVariableType":true,"supportsVariablePaging":true,"supportsRunInTerminalRequest":true,"locale":"en-us"}) InitializeRequest To client: {"seq":0,"type":"response","request_seq":1,"command":"initialize","success":true,"body":{"supportsConfigurationDoneRequest":true,"supportsSetVariable":true}} InitializeResponse From client: launch({"name":"Launch","type":"go","request":"launch","mode":"debug","program":"c:\\Users\\raborse\\go\\src\\RestAPI\\main.go","showLog":true,"trace":"verbose","logOutput":"rpc","dlvLoadConfig":{"followPointers":true,"maxVariableRecurse":1,"maxStringLen":64,"maxArrayValues":64,"maxStructFields":-1},"env":{"GOPATH":"C:\\Users\\raborse\\go","ALLUSERSPROFILE":"C:\\ProgramData","AMD_ENTRYPOINT":"vs/workbench/services/extensions/node/extensionHostProcess","APPDATA":"C:\\Users\\raborse\\AppData\\Roaming","APPLICATION_INSIGHTS_NO_DIAGNOSTIC_CHANNEL":"true","CommonProgramFiles":"C:\\Program Files\\Common Files","CommonProgramFiles(x86)":"C:\\Program Files (x86)\\Common Files","CommonProgramW6432":"C:\\Program Files\\Common Files","COMPUTERNAME":"RABORSE-1Q0HR","ComSpec":"C:\\WINDOWS\\system32\\cmd.exe","DEFLOGDIR":"C:\\ProgramData\\McAfee\\Endpoint Security\\Logs","ELECTRON_RUN_AS_NODE":"1","GOROOT":"C:\\Go\\","HOMEDRIVE":"C:","HOMEPATH":"\\Users\\raborse","LOCALAPPDATA":"C:\\Users\\raborse\\AppData\\Local","LOGONSERVER":"\\\\ADC-BGL-PN-1","NUMBER_OF_PROCESSORS":"4","OS":"Windows_NT","Path":"C:\\Program Files (x86)\\Common Files\\Oracle\\Java\\javapath;C:\\ProgramData\\Oracle\\Java\\javapath;C:\\WINDOWS\\system32;C:\\WINDOWS;C:\\WINDOWS\\System32\\Wbem;C:\\WINDOWS\\System32\\WindowsPowerShell\\v1.0\\;C:\\Program Files (x86)\\WebEx\\Productivity Tools;C:\\Program Files (x86)\\Cisco\\OSD-ShellApplications;C:\\Program Files\\PuTTY\\;C:\\Python27\\Scripts;C:\\Go\\bin;C:\\Pr[...] Using GOPATH: C:\Users\raborse\go Current working directory: c:\Users\raborse\go\src\RestAPI Running: C:\Users\raborse\go\bin\dlv.exe debug RestAPI --headless=true --listen=127.0.0.1:11879 --api-version=2 --log=true --log-output=rpc To client: {"seq":0,"type":"event","event":"output","body":{"category":"stdout","output":"API server listening at: 127.0.0.1:11879\n"}} API server listening at: 127.0.0.1:11879 To client: {"seq":0,"type":"event","event":"initialized"} InitializeEvent To client: {"seq":0,"type":"response","request_seq":2,"command":"launch","success":true} From client: setBreakpoints({"source":{"name":"main.go","path":"C:\\Users\\raborse\\go\\src\\RestAPI\\main.go"},"lines":[7],"breakpoints":[{"line":7}],"sourceModified":false}) SetBreakPointsRequest All cleared Creating on: C:\Users\raborse\go\src\RestAPI\main.go:7 To client: {"seq":0,"type":"event","event":"output","body":{"category":"stderr","output":"time=\"2019-02-09T23:59:38+05:30\" level=debug msg=\"<- RPCServer.GetVersion(api.GetVersionIn{})\" layer=rpc\n"}} time="2019-02-09T23:59:38+05:30" level=debug msg="<- RPCServer.GetVersion(api.GetVersionIn{})" layer=rpc To client: {"seq":0,"type":"event","event":"output","body":{"category":"stderr","output":"time=\"2019-02-09T23:59:38+05:30\" level=debug msg=\"-> *api.GetVersionOut{\\\"DelveVersion\\\":\\\"Version: 1.1.0\\\\nBuild: $Id: 1990ba12450cab9425a2ae62e6ab988725023d5c $\\\",\\\"APIVersion\\\":2} error: \\\"\\\"\" layer=rpc\n"}} time="2019-02-09T23:59:38+05:30" level=debug msg="-> *api.GetVersionOut{\"DelveVersion\":\"Version: 1.1.0\\nBuild: $Id: 1990ba12450cab9425a2ae62e6ab988725023d5c $\",\"APIVersion\":2} error: \"\"" layer=rpc To client: {"seq":0,"type":"event","event":"output","body":{"category":"stderr","output":"time=\"2019-02-09T23:59:38+05:30\" level=debug msg=\"<- RPCServer.CreateBreakpoint(rpc2.CreateBreakpointIn{\\\"Breakpoint\\\":{\\\"id\\\":0,\\\"name\\\":\\\"\\\",\\\"addr\\\":0,\\\"file\\\":\\\"C:\\\\\\\\Users\\\\\\\\raborse\\\\\\\\go\\\\\\\\src\\\\\\\\RestAPI\\\\\\\\main.go\\\",\\\"line\\\":7,\\\"Cond\\\":\\\"\\\",\\\"continue\\\":false,\\\"traceReturn\\\":false,\\\"goroutine\\\":false,\\\"stacktrace\\\":0,\\\"LoadArgs\\\":{\\\"FollowPointers\\\":true,\\\"MaxVariableRecurse\\\":1,\\\"MaxStringLen\\\":64,\\\"MaxArrayValues\\\":64,\\\"MaxStructFields\\\":-1},\\\"LoadLocals\\\":{\\\"FollowPointers\\\":true,\\\"MaxVariableRecurse\\\":1,\\\"MaxStringLen\\\":64,\\\"MaxArrayValues\\\":64,\\\"MaxStructFields\\\":-1},\\\"hitCount\\\":null,\\\"totalHitCount\\\":0}})\" layer=rpc\n"}} time="2019-02-09T23:59:38+05:30" level=debug msg="<- RPCServer.CreateBreakpoint(rpc2.CreateBreakpointIn{\"Breakpoint\":{\"id\":0,\"name\":\"\",\"addr\":0,\"file\":\"C:\\\\Users\\\\raborse\\\\go\\\\src\\\\RestAPI\\\\main.go\",\"line\":7,\"Cond\":\"\",\"continue\":false,\"traceReturn\":false,\"goroutine\":false,\"stacktrace\":0,\"LoadArgs\":{\"FollowPointers\":true,\"MaxVariableRecurse\":1,\"MaxStringLen\":64,\"MaxArrayValues\":64,\"MaxStructFields\":-1},\"LoadLocals\":{\"FollowPointers\":true,\"MaxVariableRecurse\":1,\"MaxStringLen\":64,\"MaxArrayValues\":64,\"MaxStructFields\":-1},\"hitCount\":null,\"totalHitCount\":0}})" layer=rpc Error on CreateBreakpoint: could not find C:\Users\raborse\go\src\RestAPI\main.go:7 All set:[null] To client: {"seq":0,"type":"response","request_seq":3,"command":"setBreakpoints","success":true,"body":{"breakpoints":[{"verified":false,"line":7}]}} SetBreakPointsResponse To client: {"seq":0,"type":"event","event":"output","body":{"category":"stderr","output":"time=\"2019-02-09T23:59:38+05:30\" level=debug msg=\"-> *rpc2.CreateBreakpointOut{\\\"Breakpoint\\\":{\\\"id\\\":0,\\\"name\\\":\\\"\\\",\\\"addr\\\":0,\\\"file\\\":\\\"\\\",\\\"line\\\":0,\\\"Cond\\\":\\\"\\\",\\\"continue\\\":false,\\\"traceReturn\\\":false,\\\"goroutine\\\":false,\\\"stacktrace\\\":0,\\\"LoadArgs\\\":null,\\\"LoadLocals\\\":null,\\\"hitCount\\\":null,\\\"totalHitCount\\\":0}} error: \\\"could not find C:\\\\\\\\Users\\\\\\\\raborse\\\\\\\\go\\\\\\\\src\\\\\\\\RestAPI\\\\\\\\main.go:7\\\"\" layer=rpc\n"}} time="2019-02-09T23:59:38+05:30" level=debug msg="-> *rpc2.CreateBreakpointOut{\"Breakpoint\":{\"id\":0,\"name\":\"\",\"addr\":0,\"file\":\"\",\"line\":0,\"Cond\":\"\",\"continue\":false,\"traceReturn\":false,\"goroutine\":false,\"stacktrace\":0,\"LoadArgs\":null,\"LoadLocals\":null,\"hitCount\":null,\"totalHitCount\":0}} error: \"could not find C:\\\\Users\\\\raborse\\\\go\\\\src\\\\RestAPI\\\\main.go:7\"" layer=rpc From client: setExceptionBreakpoints({"filters":[]}) To client: {"seq":0,"type":"response","request_seq":4,"command":"setExceptionBreakpoints","success":true} From client: configurationDone(undefined) ConfigurationDoneRequest ContinueRequest To client: {"seq":0,"type":"response","request_seq":5,"command":"configurationDone","success":true} ContinueResponse To client: {"seq":0,"type":"event","event":"output","body":{"category":"stderr","output":"time=\"2019-02-09T23:59:38+05:30\" level=debug msg=\"(async 3) <- RPCServer.Command(api.DebuggerCommand{\\\"name\\\":\\\"continue\\\",\\\"ReturnInfoLoadConfig\\\":null})\" layer=rpc\n"}} time="2019-02-09T23:59:38+05:30" level=debug msg="(async 3) <- RPCServer.Command(api.DebuggerCommand{\"name\":\"continue\",\"ReturnInfoLoadConfig\":null})" layer=rpc From client: threads(undefined) To client: {"seq":0,"type":"response","request_seq":6,"command":"threads","success":true,"body":{"threads":[{"id":1,"name":"Dummy"}]}} To client: {"seq":0,"type":"event","event":"output","body":{"category":"stdout","output":"Hello World !!!\n"}} Hello World !!! To client: {"seq":0,"type":"event","event":"output","body":{"category":"stderr","output":"time=\"2019-02-09T23:59:38+05:30\" level=debug msg=\"(async 3) -> rpc2.CommandOut{\\\"State\\\":{\\\"Running\\\":false,\\\"Threads\\\":null,\\\"NextInProgress\\\":false,\\\"exited\\\":true,\\\"exitStatus\\\":0,\\\"When\\\":\\\"\\\"}} error: \\\"\\\"\" layer=rpc\n"}} time="2019-02-09T23:59:38+05:30" level=debug msg="(async 3) -> rpc2.CommandOut{\"State\":{\"Running\":false,\"Threads\":null,\"NextInProgress\":false,\"exited\":true,\"exitStatus\":0,\"When\":\"\"}} error: \"\"" layer=rpc continue state {"Running":false,"Threads":null,"NextInProgress":false,"exited":true,"exitStatus":0,"When":""} To client: {"seq":0,"type":"event","event":"terminated"} TerminatedEvent From client: disconnect({"restart":false}) DisconnectRequest HaltRequest To client: {"seq":0,"type":"event","event":"output","body":{"category":"stderr","output":"time=\"2019-02-09T23:59:38+05:30\" level=debug msg=\"(async 4) <- RPCServer.Command(api.DebuggerCommand{\\\"name\\\":\\\"halt\\\",\\\"ReturnInfoLoadConfig\\\":null})\" layer=rpc\n"}} time="2019-02-09T23:59:38+05:30" level=debug msg="(async 4) <- RPCServer.Command(api.DebuggerCommand{\"name\":\"halt\",\"ReturnInfoLoadConfig\":null})" layer=rpc Failed to halt - Process 18676 has exited with status 0 DisconnectRequest to parent To client: {"seq":0,"type":"response","request_seq":7,"command":"disconnect","success":true} DisconnectResponse To client: {"seq":0,"type":"event","event":"output","body":{"category":"stderr","output":"time=\"2019-02-09T23:59:38+05:30\" level=debug msg=\"(async 4) -> <nil>null error: \\\"Process 18676 has exited with status 0\\\"\" layer=rpc\n"}} time="2019-02-09T23:59:38+05:30" level=debug msg="(async 4) -> <nil>null error: \"Process 18676 has exited with status 0\"" layer=rpc

@ramya-rao-a
Copy link
Contributor

@ravidborse I have created a new issue to track the problem you are seeing. Please see #2318

All, I am closing this issue as concluded in
#1307 (comment) and
#1307 (comment)

If anyone sees this issue when using symlinks, feel free to ping me on the Gophers Slack channel and I can help you debug using the source code of this extension as I am not able to repro this.

@microsoft microsoft locked and limited conversation to collaborators Feb 10, 2019
Sign up for free to subscribe to this conversation on GitHub. Already have an account? Sign in.
Labels
None yet
Projects
None yet
Development

No branches or pull requests