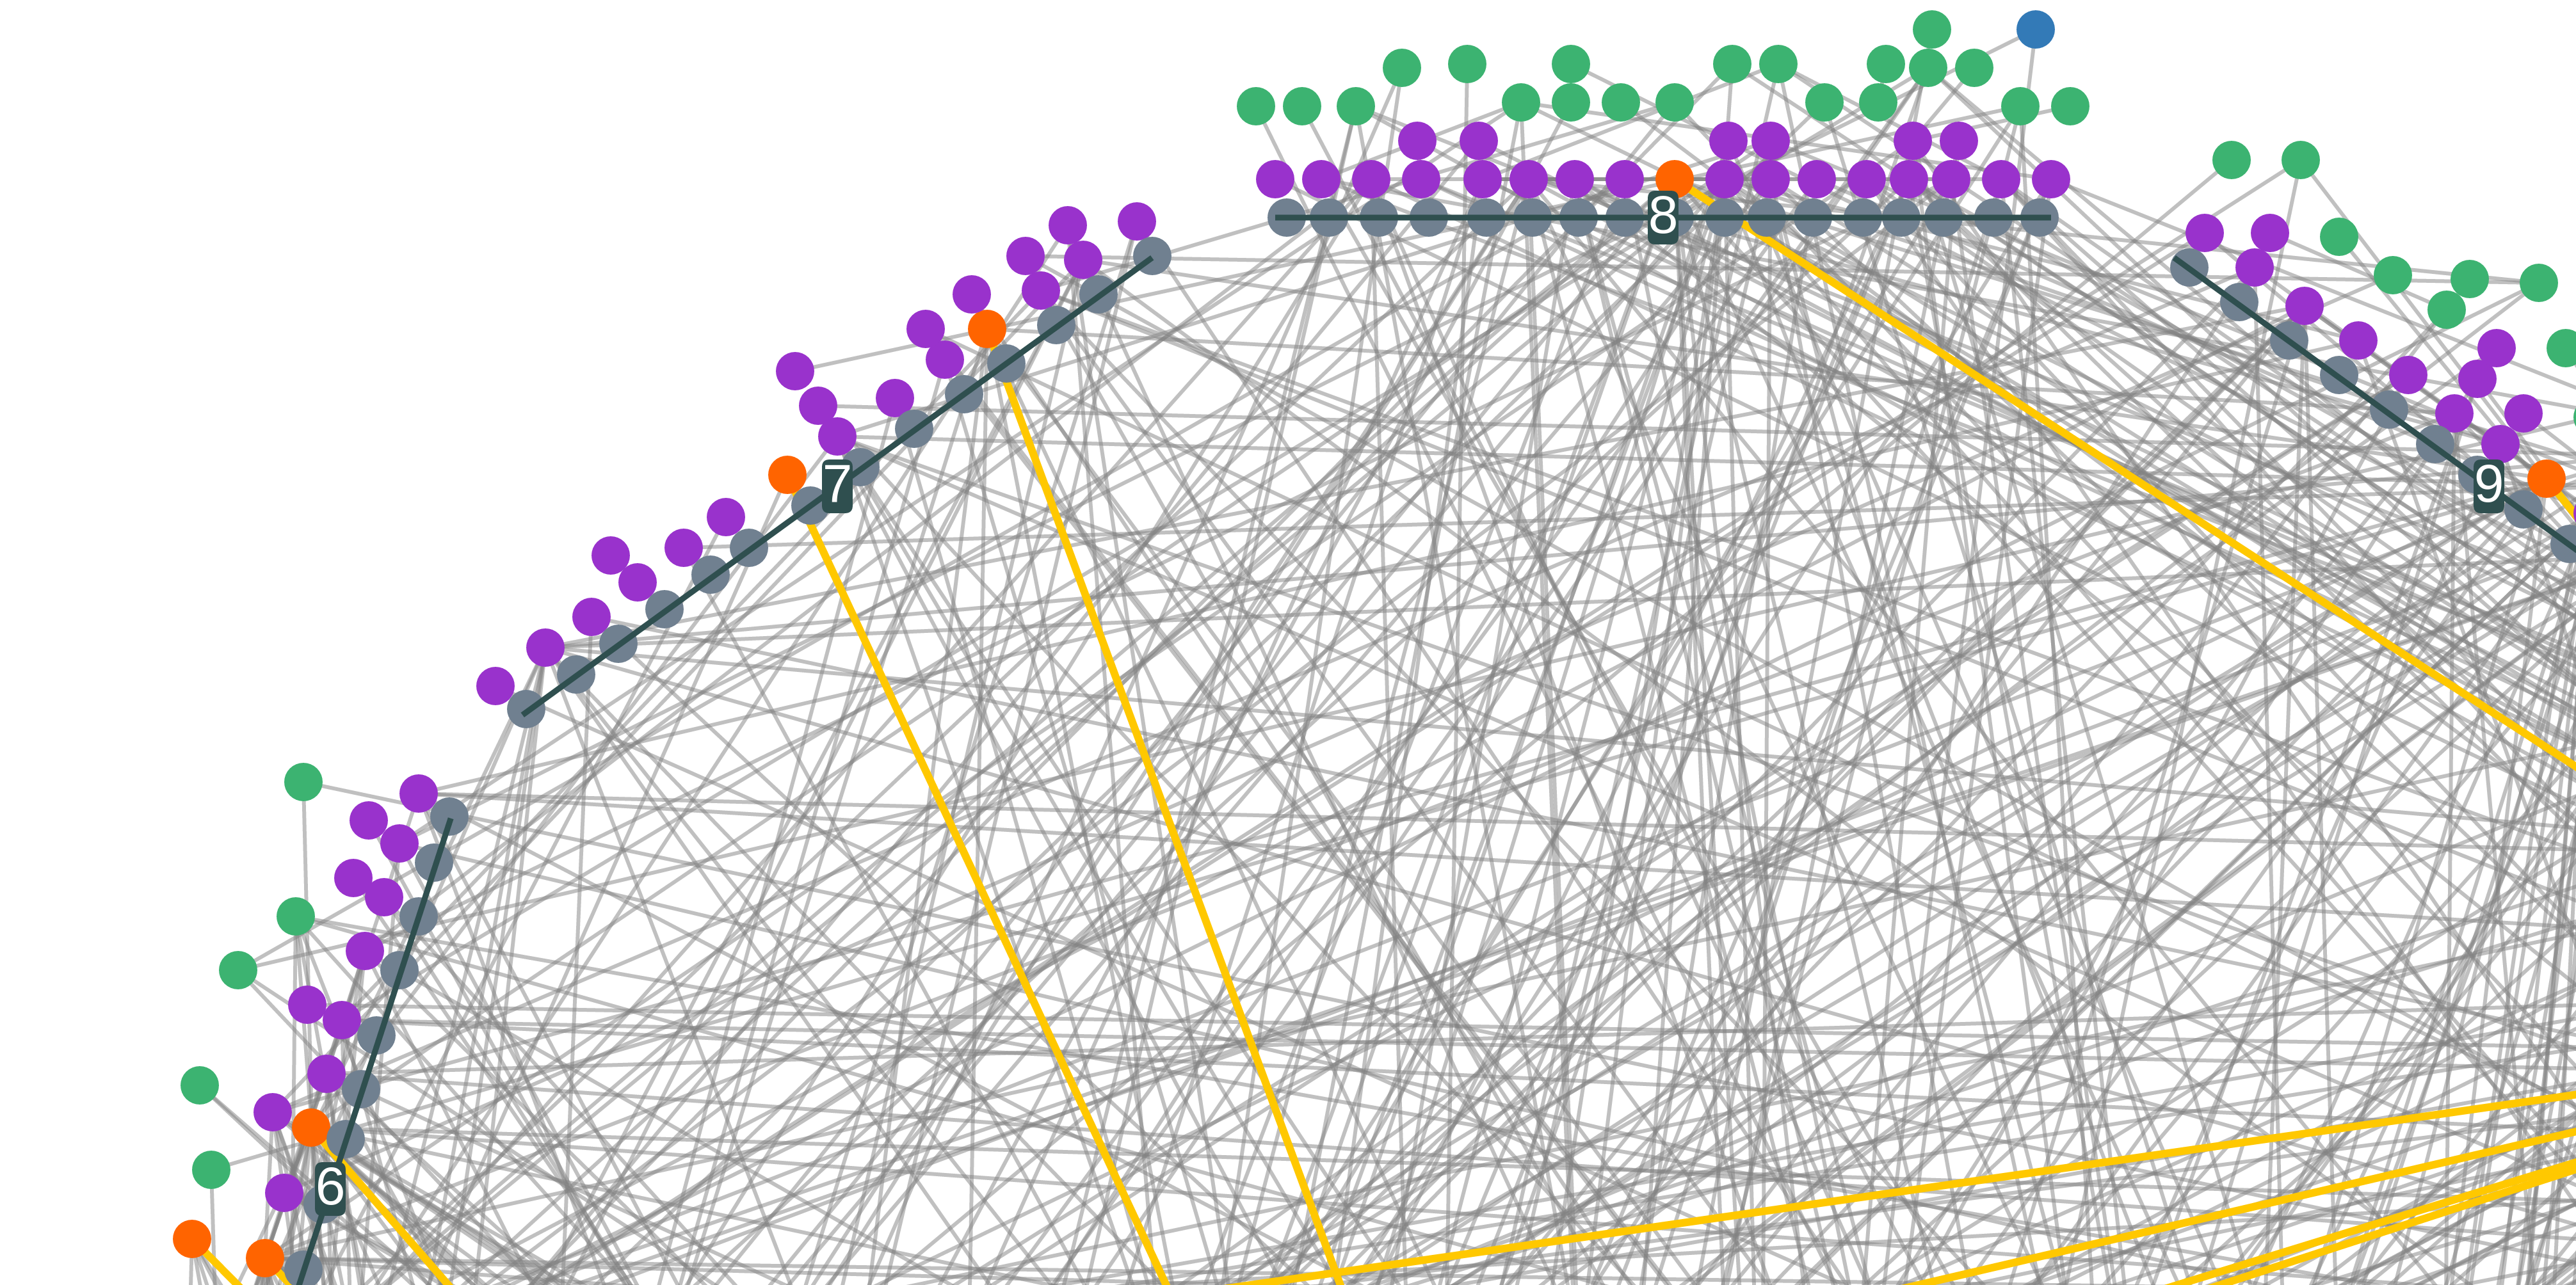
Cytoscape.js layout for genomics data that visualizes inter locus relationships. The layout is based on a circle of chromosomes, upon which the genes are stacked, as seen above. This was designed in conjunction with the general Coexpression Browser site. For an in production example, take a look at the CoEx Browser, the code for which can be found here.
- Cytoscape.js ^2.6.0
Simply include this file in your source, or pull it directly using RawGit.
padding: 100, // Padding around the layout
boundingBox: undefined, // Constrain layout bounds; {x1,y1,x2,y2} or {x1,y1,w,h}
chromPadding: 5, // Ammount of padding at the end of the chrom lines in degrees
nodeDiameter: 30, // Diameter of the genes, for stacking and spacing
radWidth: 0.015, // Thickness of the Chromosomes lines (in radians)
logSpacing: false, // Log or linear SNP layout along Chromosome
snpLevels: 3, // How many colors to stripe the SNPs

// Defines which Chromosome the gene is on
getChrom: function(ele){return ele.data('chrom');},

// Defines which SNP the gene is on
getSNP: function(ele){return ele.data('snp');},

// Defines the gene's starting and ending positions (in base pairs)
getStart: function(ele){return ele.data('start');},
getEnd: function(ele){return ele.data('end');},

// Optional Callbacks
ready: function(){}, // on layoutready
stop: function(){}, // on layoutstopFor this layout, each gene must have each of the following pieces of information:
- Chromosome
- SNP
- Start Position
- End Position
In the layout options, functions must be defined that return this information for each gene. The default functions pull this information from the elements data attribute, assuming the following format for the original data provided, though these can functions can be altered as needed:
{data:{id: 'a', snp: 'v', chrom: '1', start: 3500, end: 3525}}For reference, this is the general format of the edge data structure, but it is not customized for this layout in any way:
{data:{id: 'ad', source: 'a', target: 'd'}}