mrnetops/fastly-dashboards contains a Docker Compose setup, which boots up a full fastly-exporter + Prometheus + Alertmanager + Grafana + Fastly dashboard stack with Slack alerting integration.
| Fastly Service | Fastly Top Services | Fastly Top Datacenters |
|---|---|---|
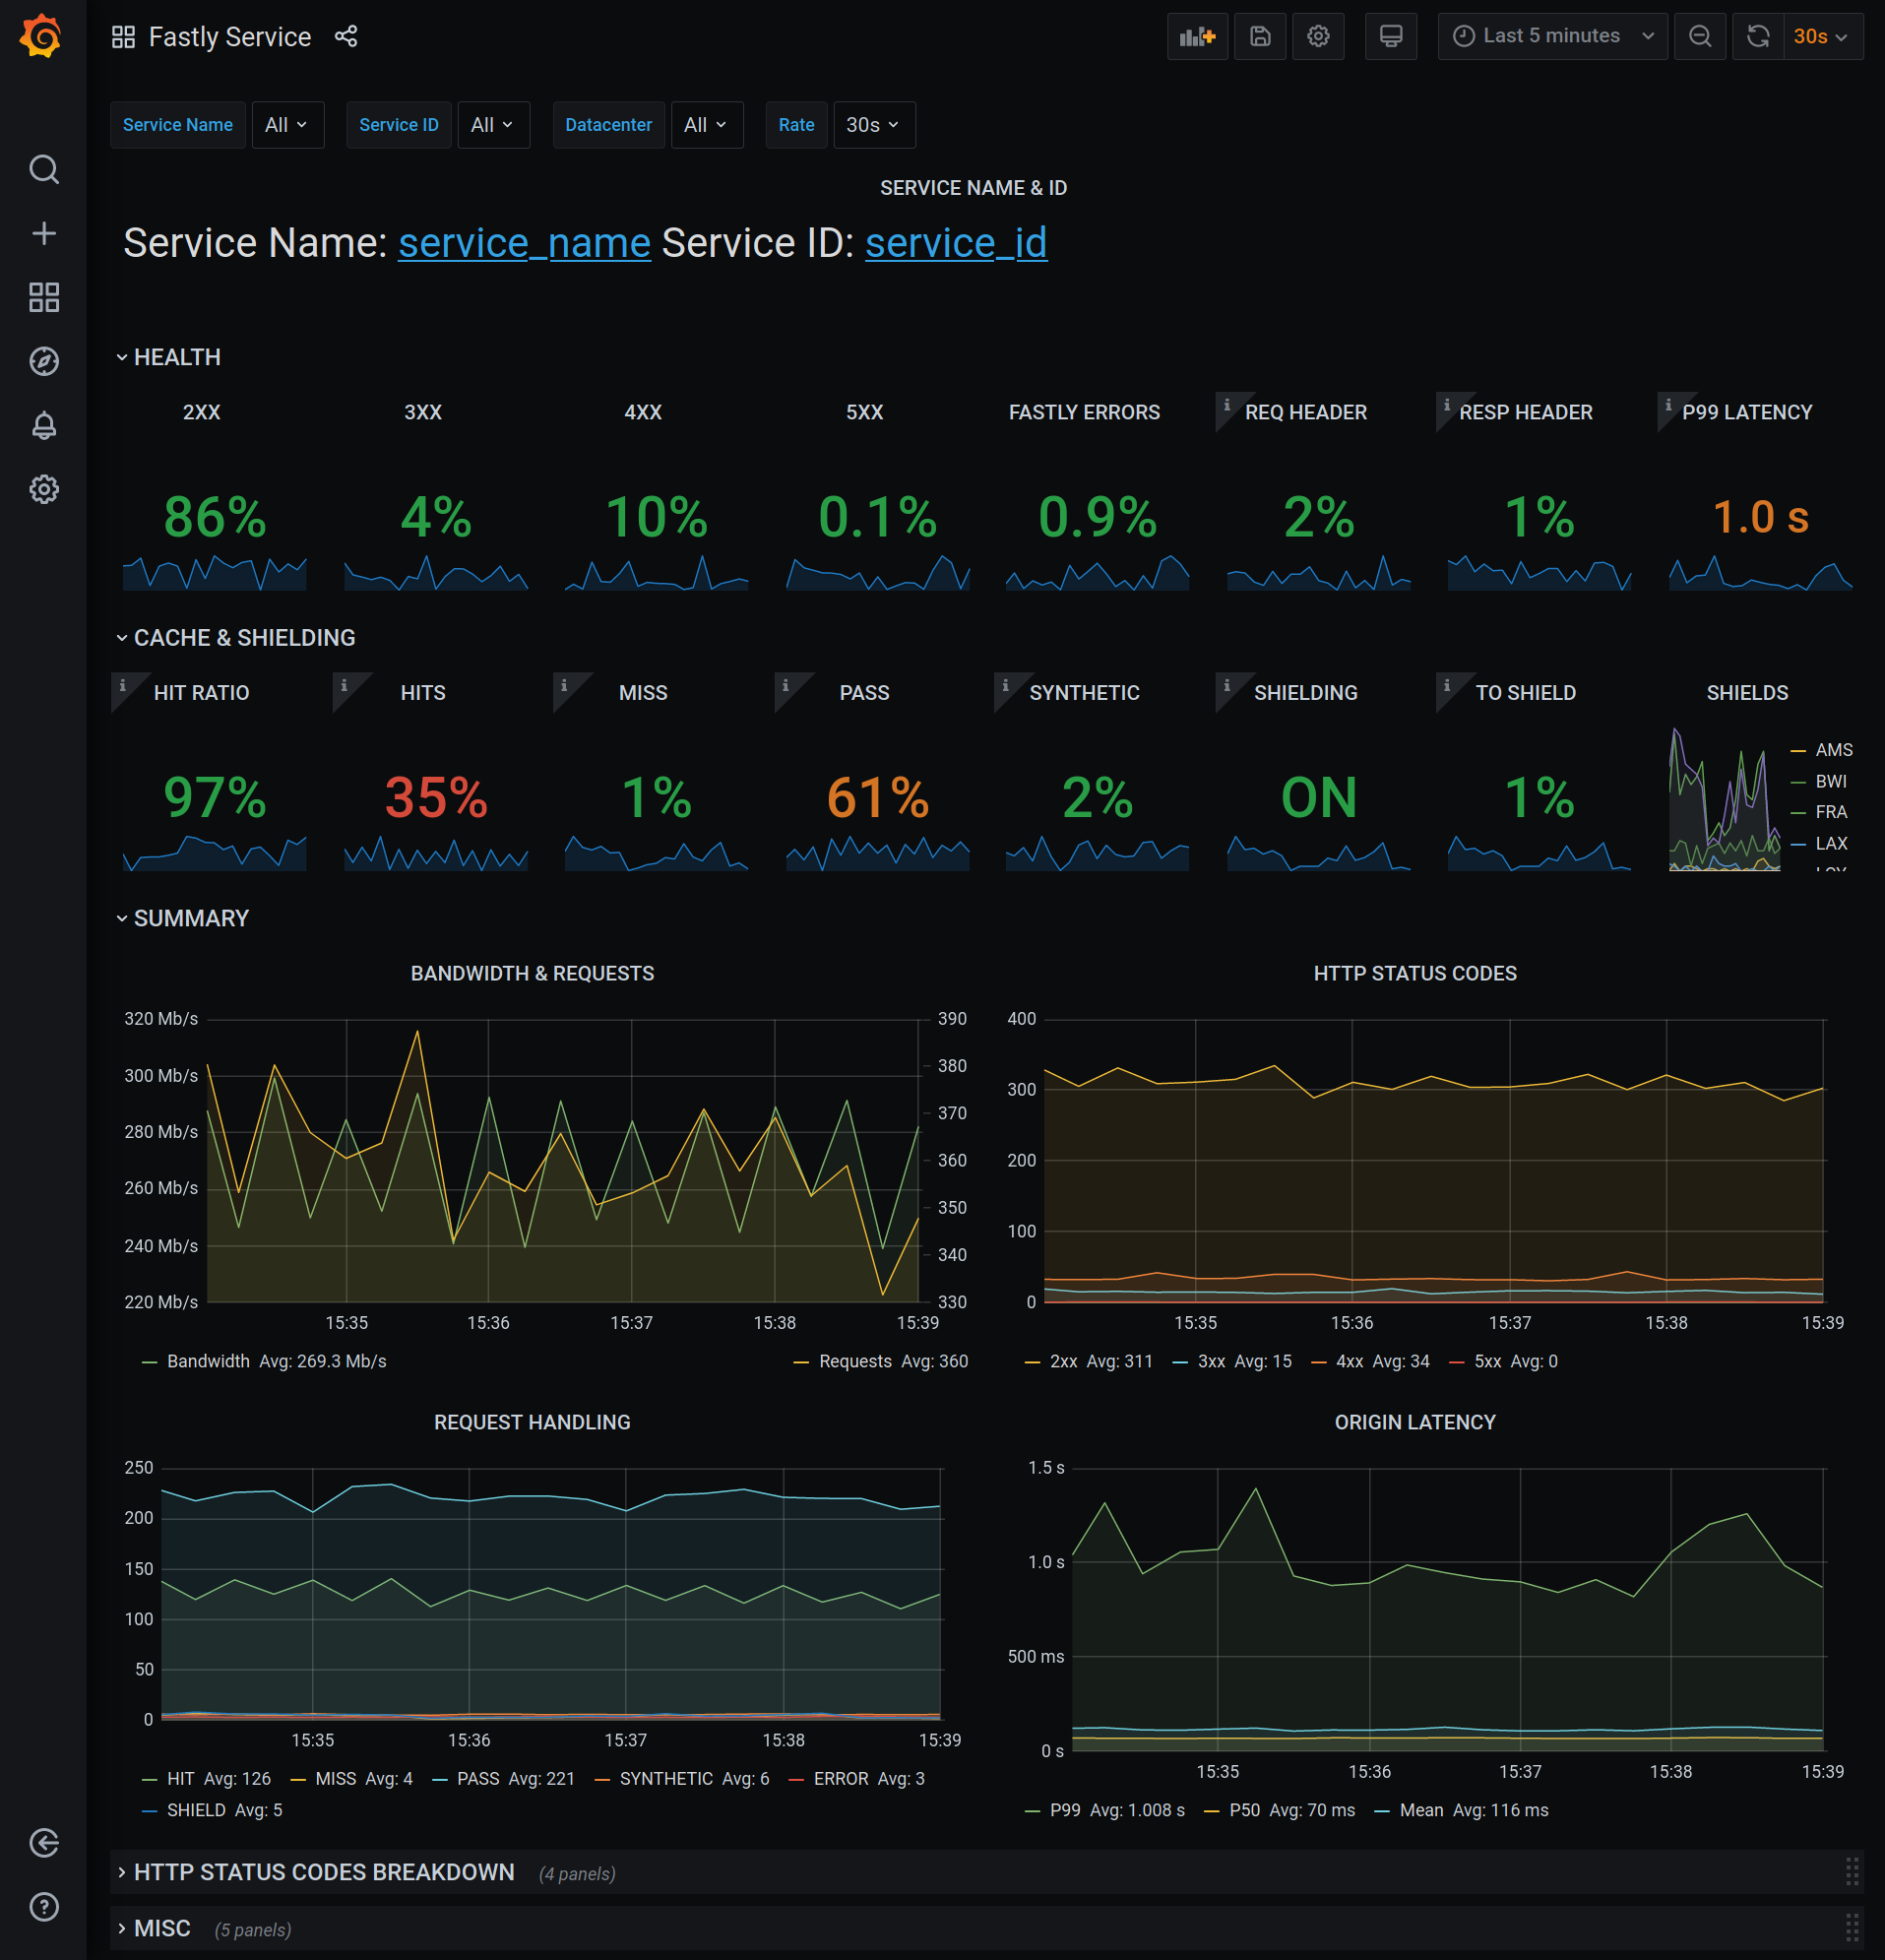 |
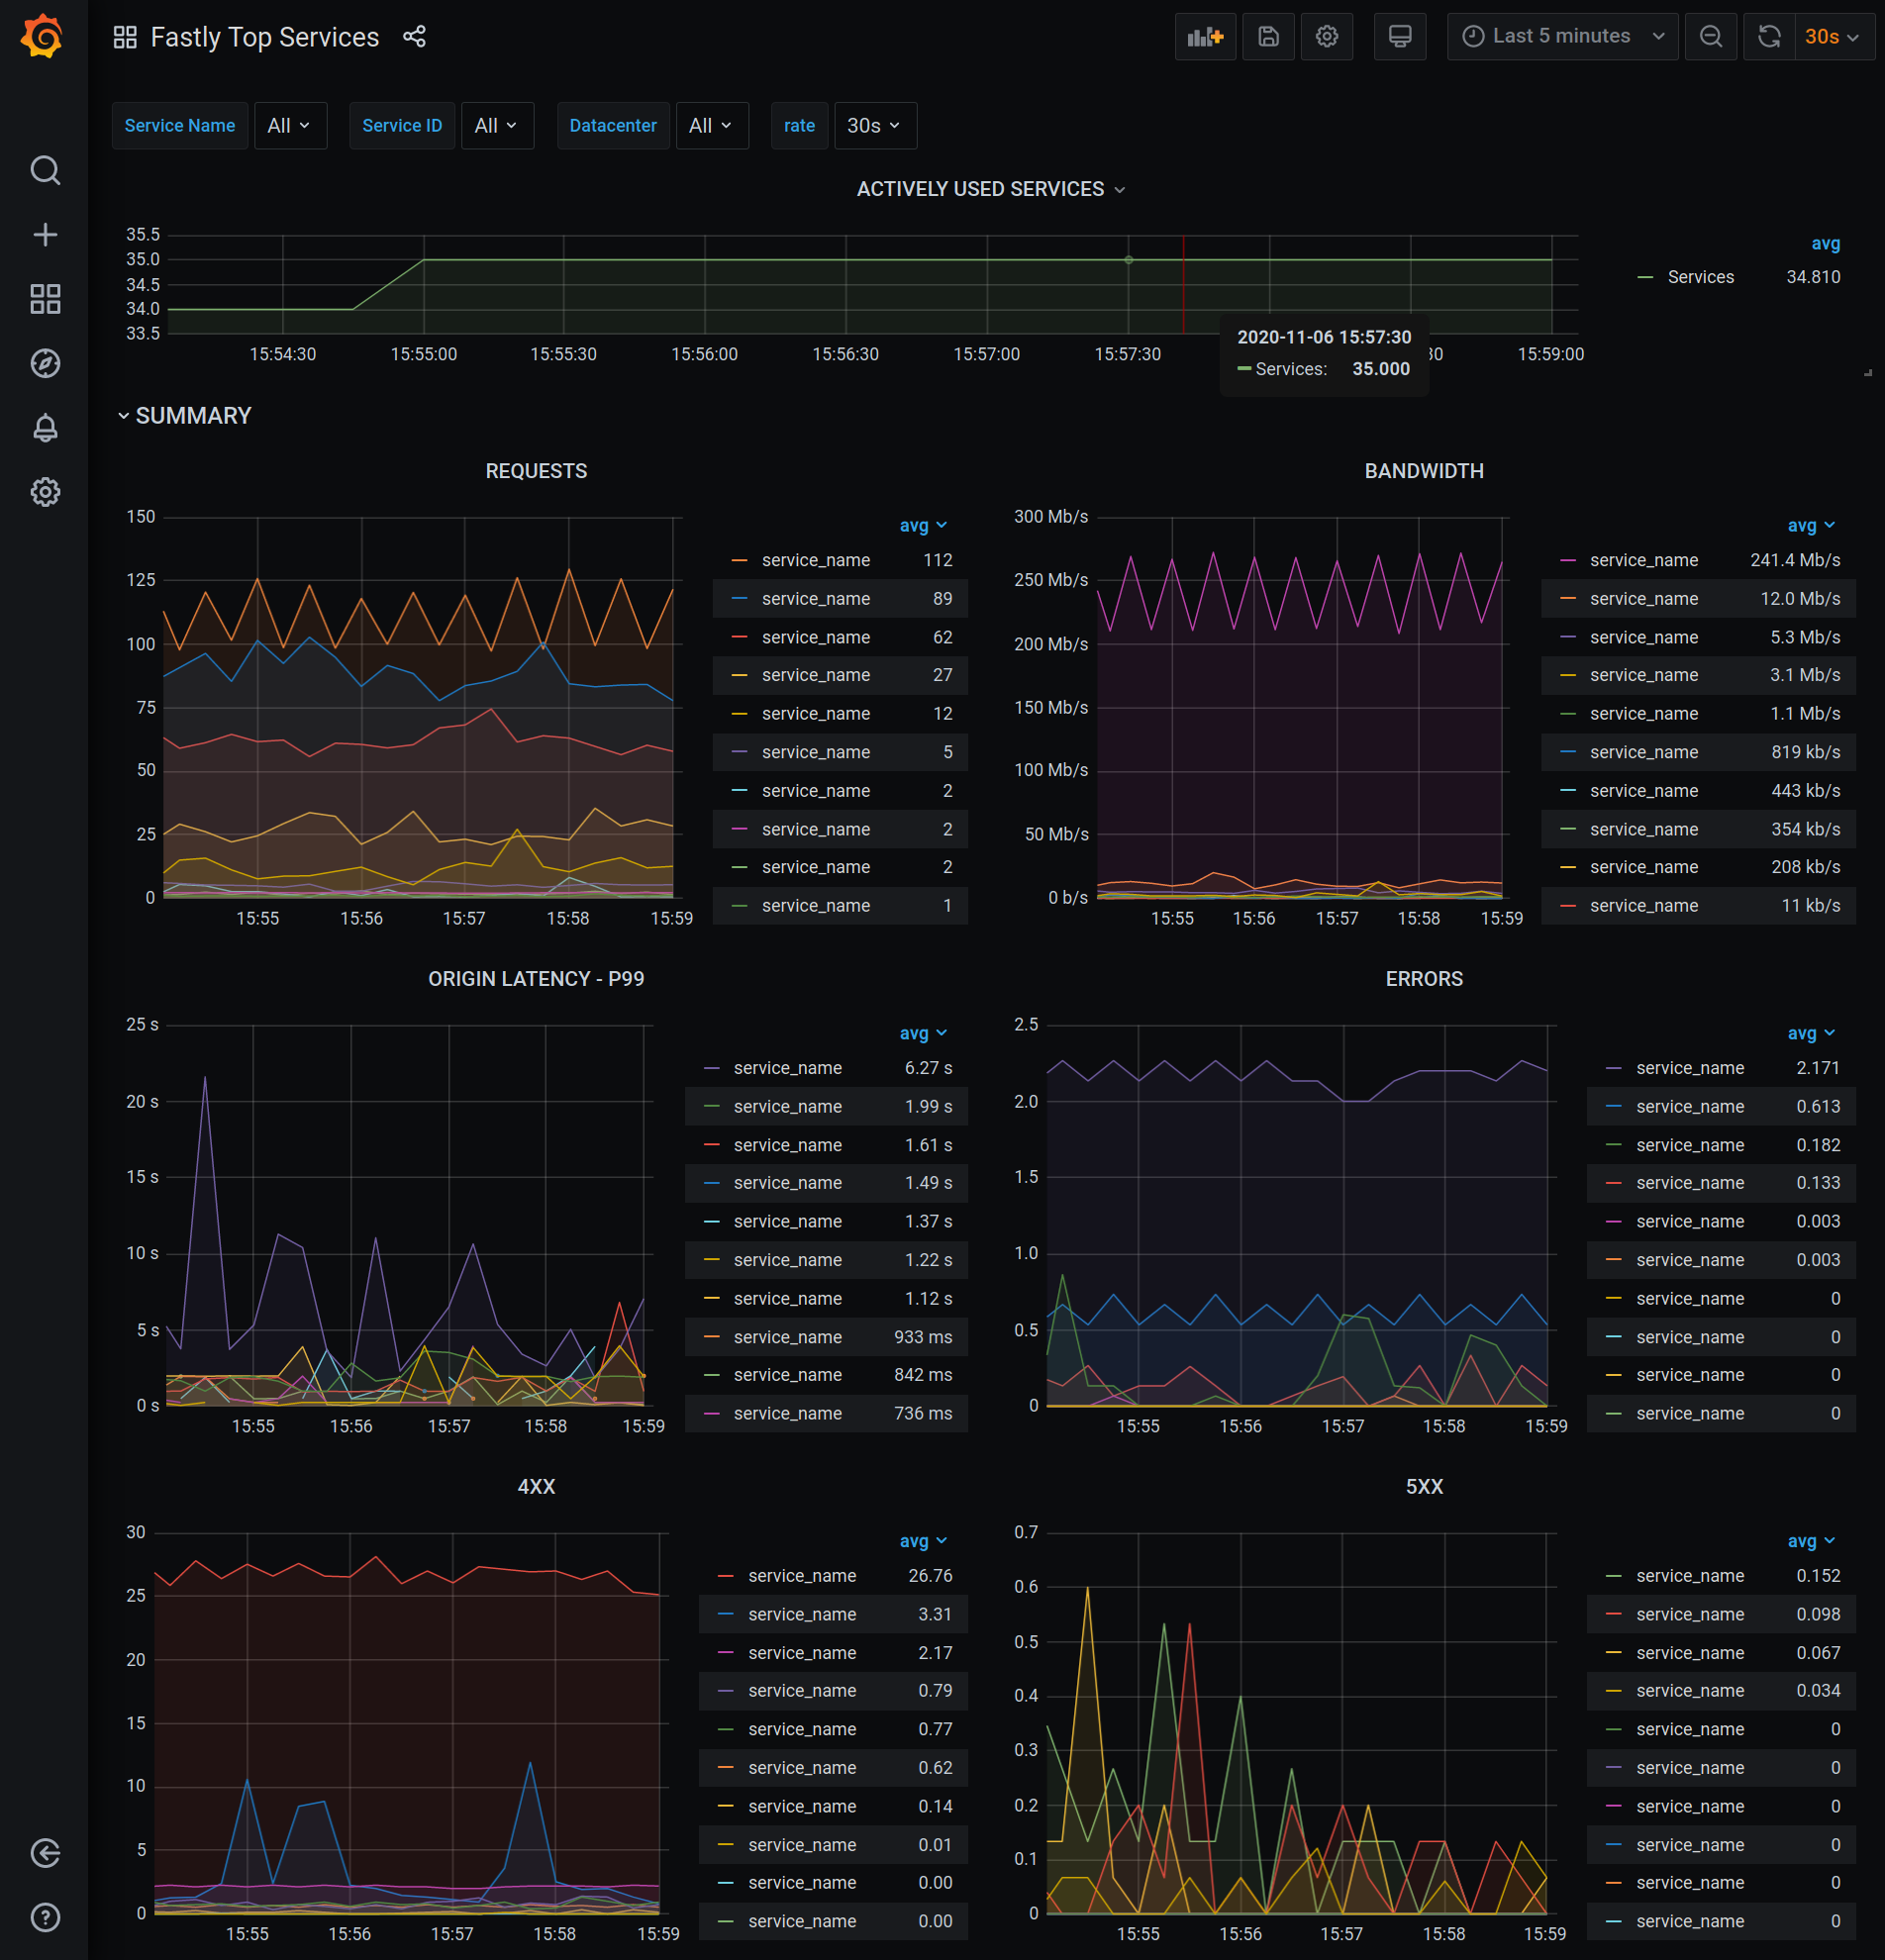 |
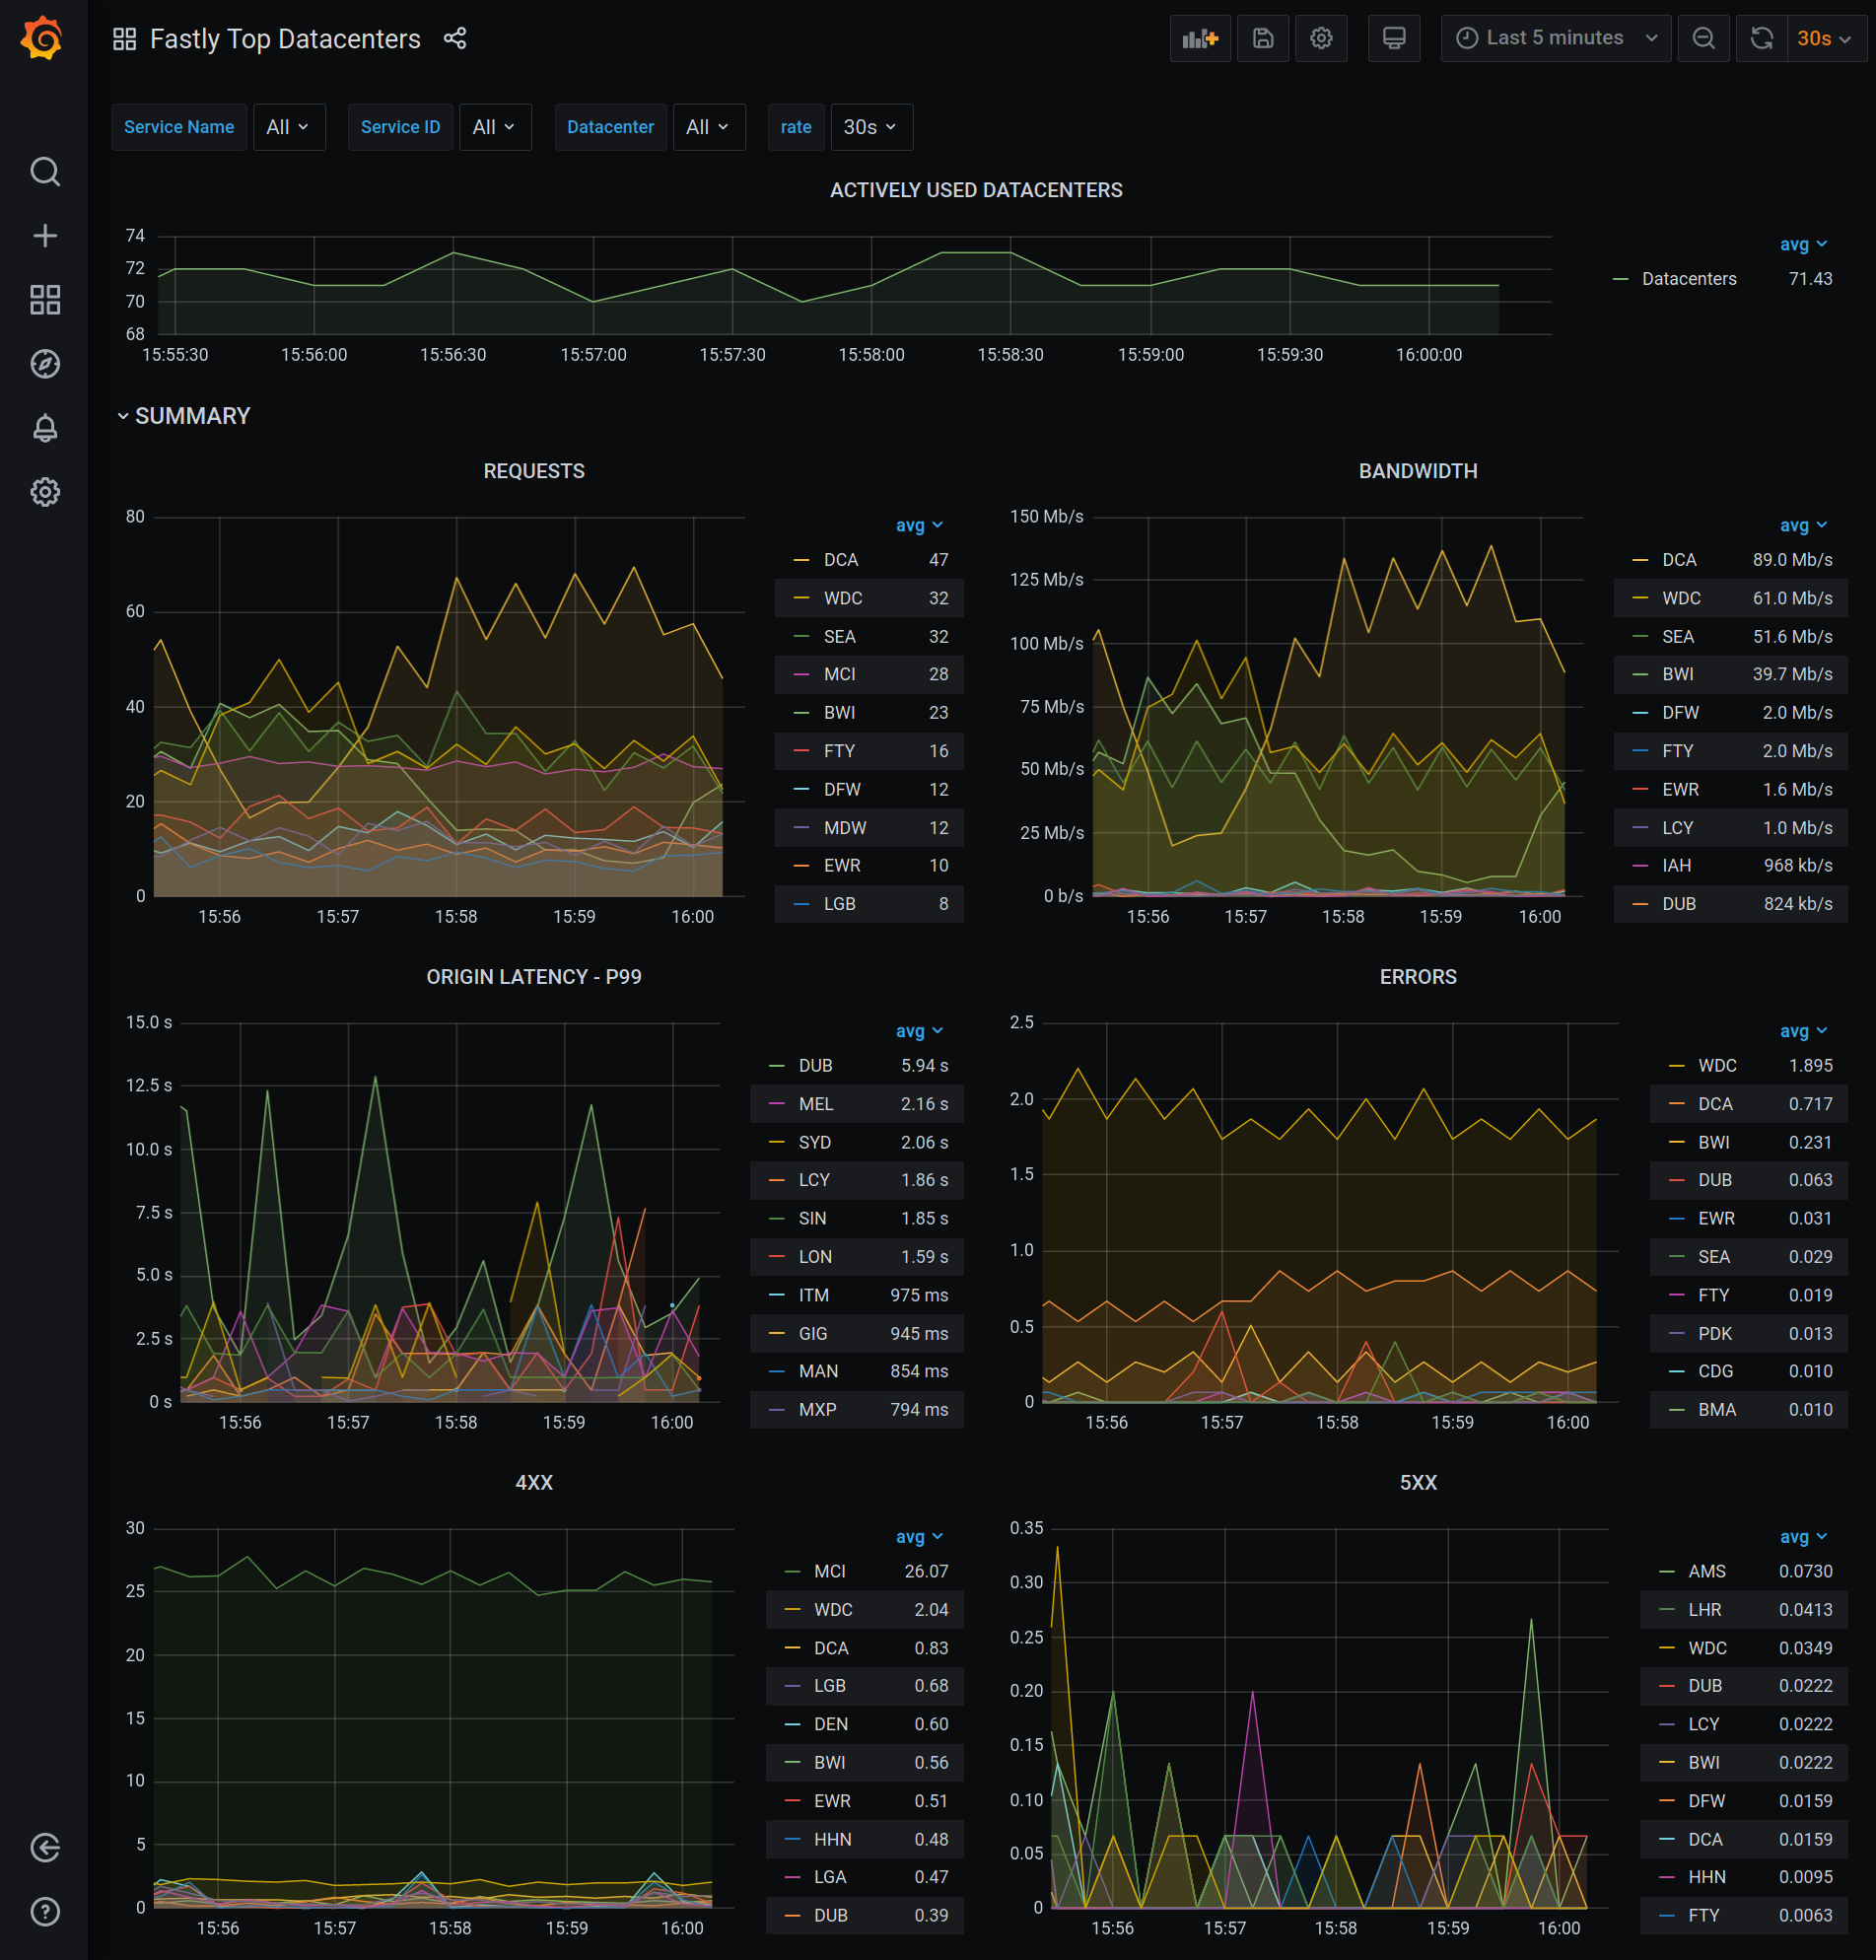 |
| Fastly Top Origins | Slack Alerts |
|---|---|
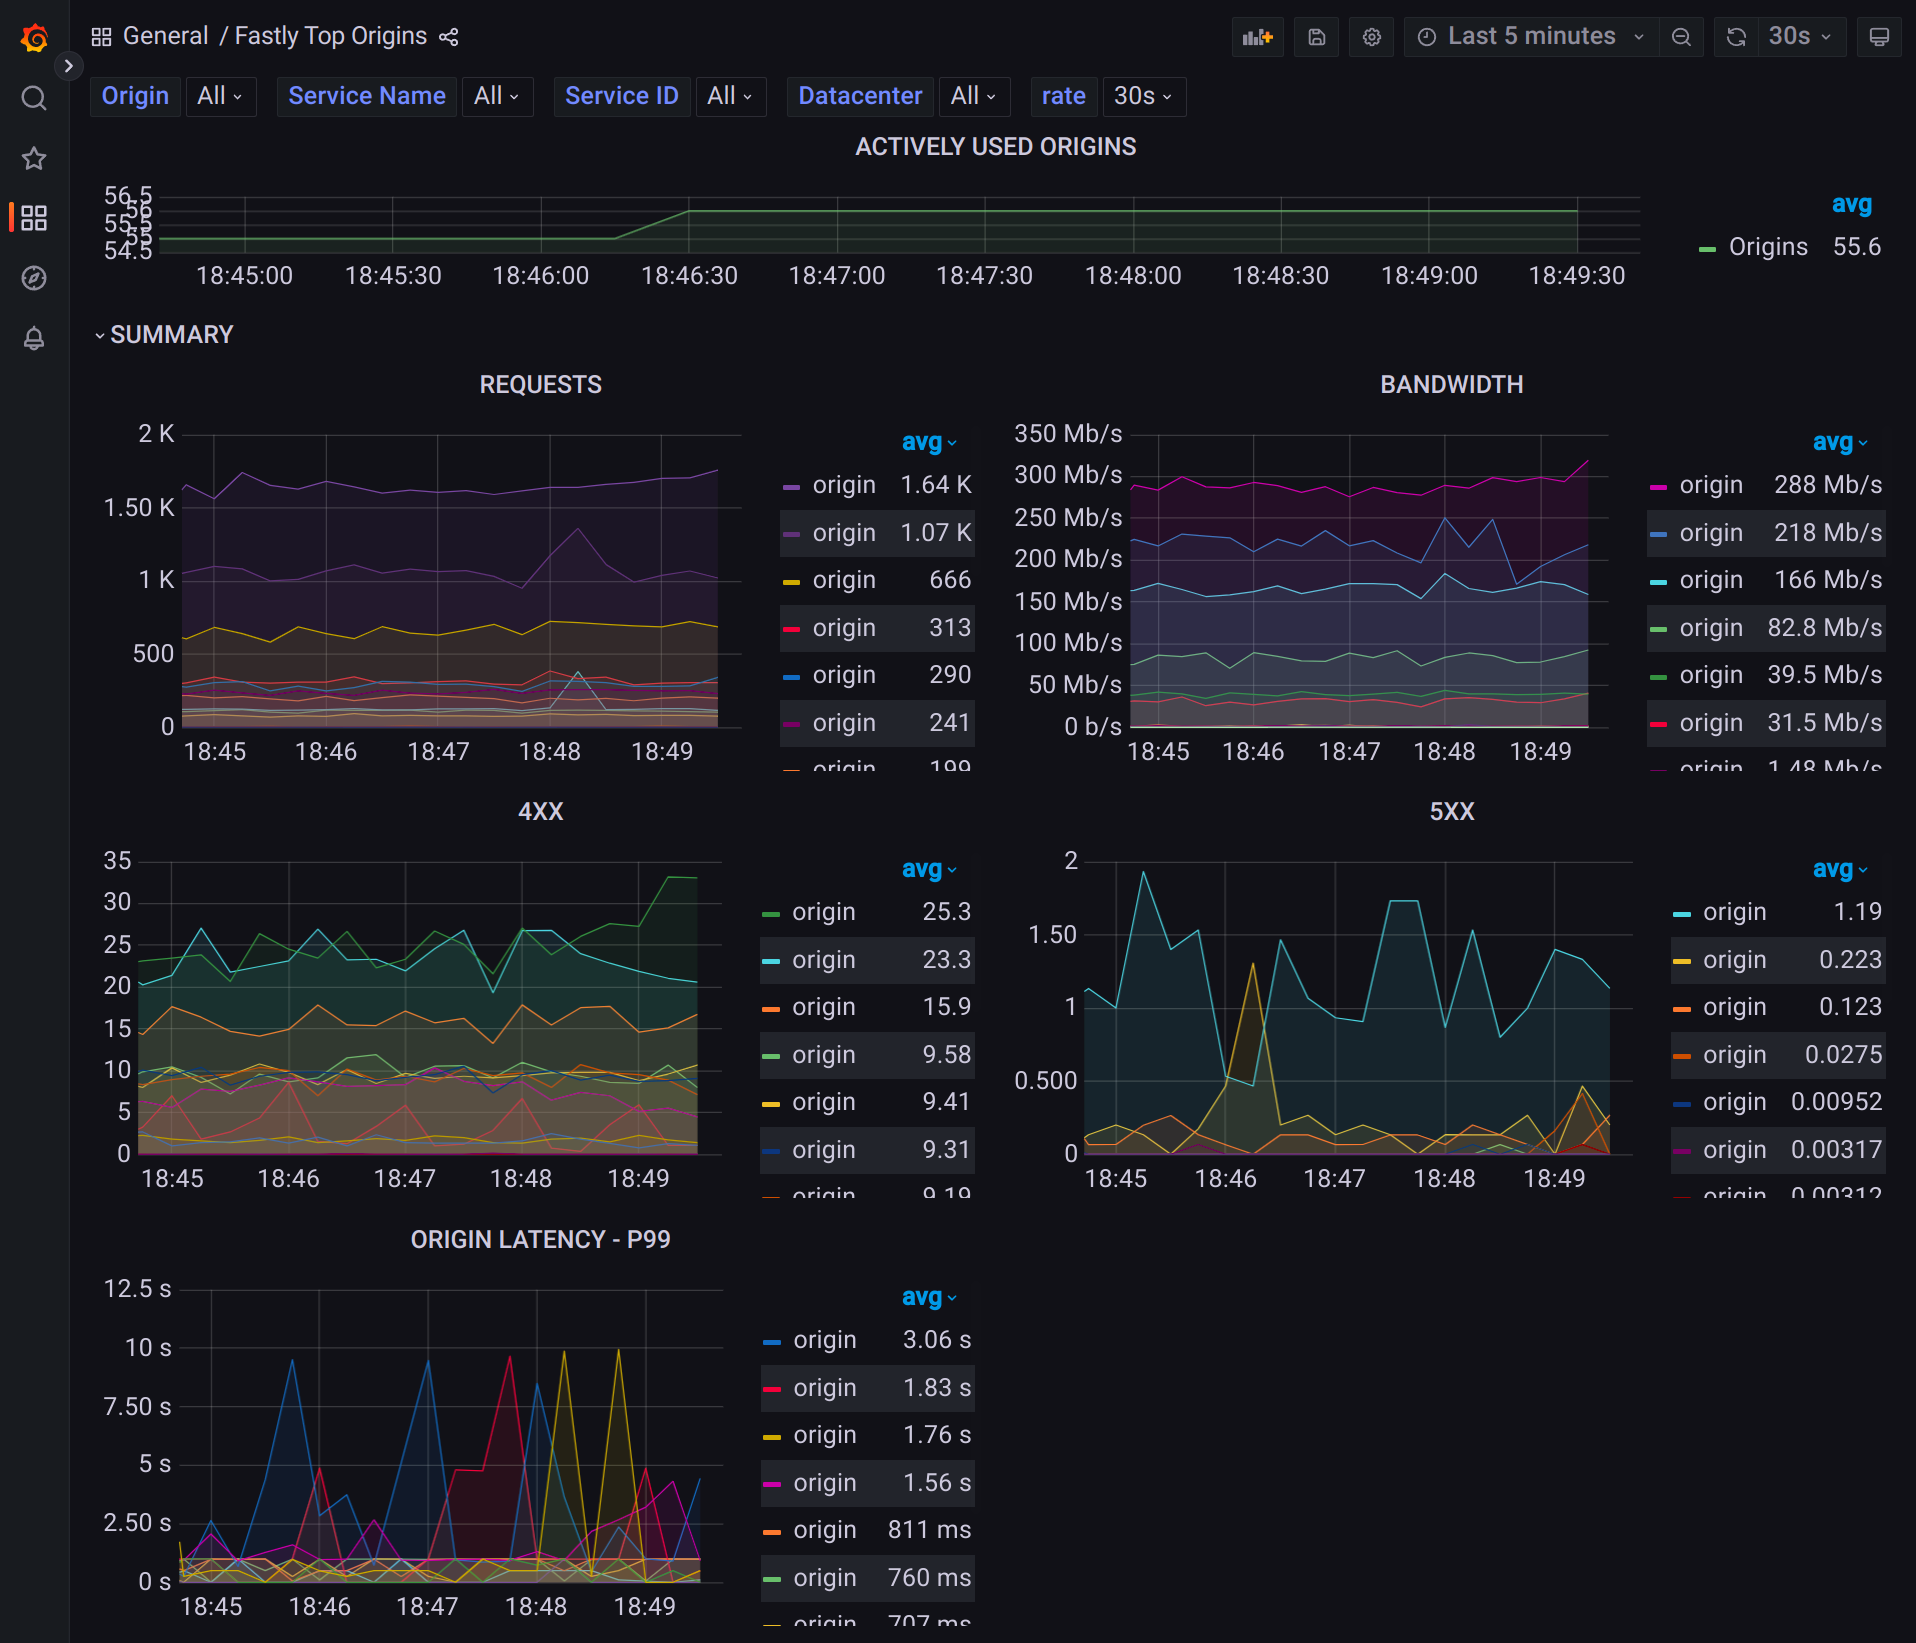 |
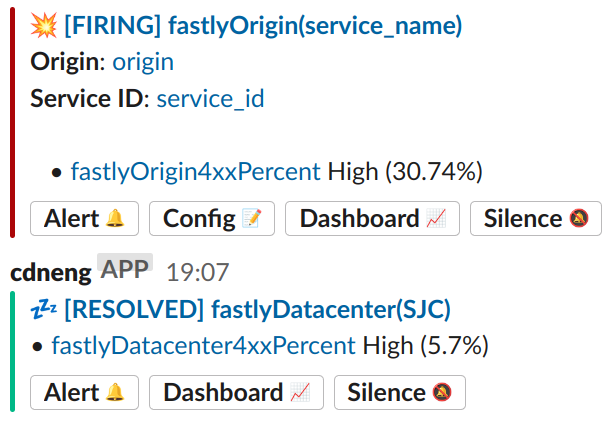 |
export FASTLY_API_TOKEN=$YOUR_TOKEN
export SLACK_API_URL=$YOUR_URL
export SLACK_CONFIG_CHANNEL=$YOUR_CHANNEL

git clone https://github.com/mrnetops/fastly-dashboards.git
cd fastly-dashboards
Prerequisites
- docker
docker compose up
Prerequisites
- docker
- docker-compose >= 1.29
docker-compose up
Note: we have to work around nerdctl not supporting
- environmental variable interpolation from the parent environment
- depends_on: service_completed_successfully
env > .env
nerdctl run envsubst
nerdctl compose up
Access the Grafana dashboard at http://localhost:3000.
Per https://github.com/docker-archive/docker-snap#usage
Docker Snap requires that all files that docker needs access to live within your $HOME folder.
You may run into this if you attempt to run under /tmp for example.
Processing Fastly metrics can be intensive, especially if you have a lot of services.
Try adding this when running to only harvest stats for 1/10th of yer services
export FASTLY_EXPORTER_OPTIONS="-service-shard 1/10"
channel \"#NO_SLACK_CONFIG_CHANNEL\": unexpected status code 404: 404 page not found
Check that the the following are being exported and have the correct values
- $SLACK_API_URL
- $SLACK_CONFIG_CHANNEL
