This MEF 3.0 viewer is a python-based GUI with a c-code server. Both the python and c are intended to be platform independent, and have been tested on Windows 10 and MacOS X 11.6.
To launch, use "python3 eeg_view.py". Upon loading a data session, the GUI launches the page server as a subprocess, and creates a temporary folder in an appropriate location. The files within that temporary folder are used to communicate with the page server. These temp folders and temp files should be automatically deleted (depending on the OS, it could be upon reboot, or after 3 days, etc), so neither the GUI or server attempts to delete the files.
Upon viewing of a data session, the arrow keys navigate, with up/down controlling the amplitude on the y-axis. The space bar can be used to move 1 second to the right (useful for centering a particular data feature). The user can mouse click on the buffer bar at the bottom to jump to a different location. Major discontinuities (greater than 1 minute) are indicated in white on the buffer bar. The timestamp shown in the lower left (which is expressed in the local time zone) corresponds with the leftmost x-axis value on the current screen.
The page server code is in the page_server subdirectory. It requires the code from the meflib repositiory. The output executable should be either "eeg_page_server" (for Mac) or "eeg_page_server.exe" (for Windows) and should be placed at the same directory level as the python GUI code.
There is an unresolved issue with meflib.c where line 5934 needs to be uncommented - on some OS's these files need to be closed to prevent too many files from being open at the same time: segment->time_series_data_fps->directives.close_file = MEF_FALSE;
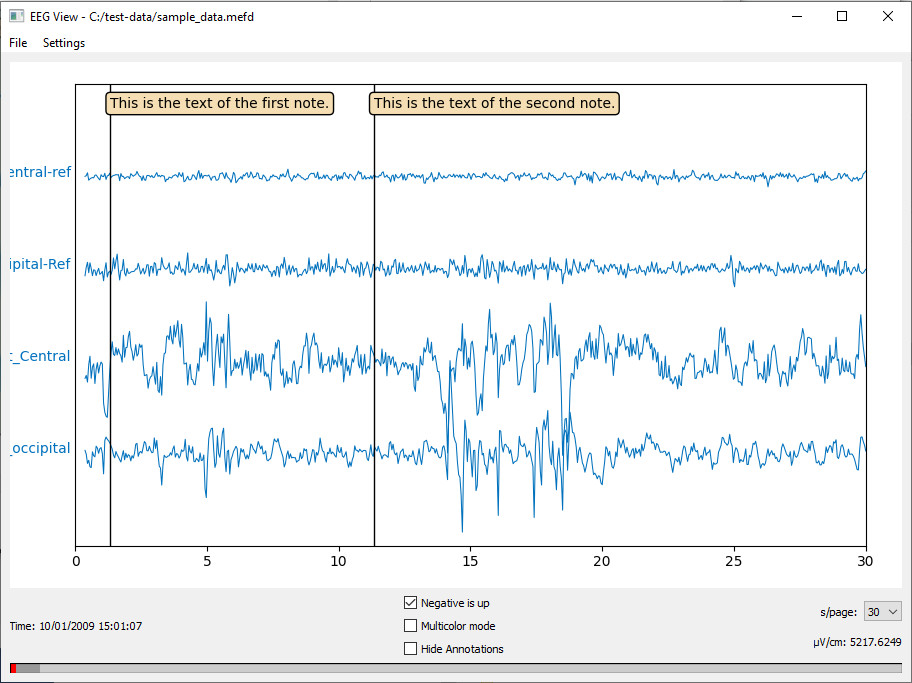
Sample data for MEF 3.0 data can be found here. Below is that sample data plotted using this viewer, on Windows 10 operating system.